Improve The User Experience By Tracking Errors
It’s easy to see your top-visited pages, navigation patterns and conversion metrics using visitor-tracking tools like Google Analytics. However, this data doesn’t show the roadblocks that users typically run into on your website. Tracking and optimizing error messages will help you measurably improve your website’s user experience. We’ll walk through how to add error tracking using Google Analytics, with some code snippets. Then, we’ll assemble the data and analyze it to figure out how to improve your error message drop rates.
What To Track
The most helpful errors to track are form-field errors and 404 pages. Form-field errors can be captured after the form’s validation has run; this can be client-side or server-side, as long as you can trigger a Google Analytics event when an error message appears to a user. (We’ll be using Google Analytics in this article, but you can apply these concepts to many visitor-tracking tools, such as Omniture and Performable.)
Form-Field Errors
Forms that allow users to create an account, log in or check out are the places where most visitors will hit stumbling blocks that you are not aware of. Pick pages with forms that have high exit rates or that have high total page views but low unique page views. This could indicate that users are repeatedly trying to submit the form but are encountering problems.
The easiest way to track form-field errors with Google Analytics is to track an event each time a user sees an error message. The specification for _trackEvent is:
_trackEvent(category, action, opt_label, opt_value)If the form is for signing in and the user submits an incorrect password, I might use the following code:
<script type='text/javascript'>
  _gaq.push(['_trackEvent', 'Error', 'Sign In', 'Incorrect Password']);
</script>
If possible, store the error message’s text as a variable, and call this variable within Google Analytics’ event tracker. This way, as you change the text of the error message over time, you can measure the differences between the versions. For example, in PHP, I might write:
<?php
  $message = 'Incorrect password';
  if ($message) { ?>
  <script type='text/javascript'>
    _gaq.push(['_trackEvent', 'Error', 'Sign In', '<?php echo $message ?>']);
  </script>
<?php } ?>
If it’s possible for the user to receive more than one error message on the page at a time (for example, if they’ve missed more than one field in a form), then you might want to store all of the messages in the same event tracker. Use an array, or concatenate them into the variable that you call in your event tracker. You might see that a user has attempted to skip all of the fields in a form; this could indicate that they are testing the form to see which fields are required and which are optional. You’ll notice this if you have tracked an event that includes all missing fields in the same event. However, storing all of the messages in the same event might prevent you from tracking the effects of individual error messages over time, so begin by tracking each error message separately.
404 Pages
You might already know how many times your 404 page is being viewed, but do you know which URLs the users were trying to reach, or what websites are referring to those URLs? By adding a tracking code to your 404 pages, you can see both. The following snippet will include the URL that generated the 404 error and the URL that linked to that page:
<script type="text/javascript">
  _gaq.push(['_trackEvent', 'Error', '404', 'page: ' + document.location.pathname + document.location.search + ' ref: ' + document.referrer ]);
</script>
Google Analytics Reports
As you track errors as events using Google Analytics, you will find a list of them in your reports under “Event Tracking,” under the “Content” menu. Choose “Categories,” and then start drilling down through your error types.
You can save any of these graphs to your dashboard with the “Add to Dashboard” button at the top of each screen. I find it useful to list the top 404 errors on my dashboard, so that I can see whether anything new has popped up when I log in.
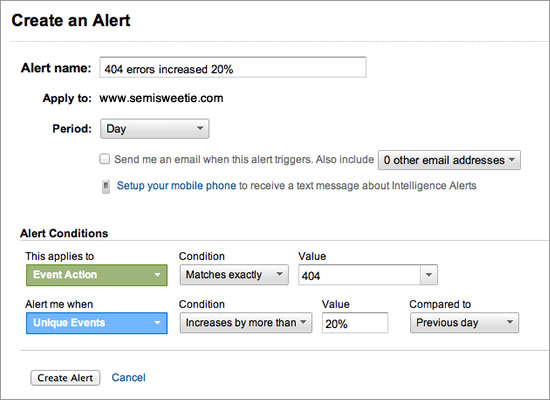
Google Analytics also lets you know of spikes in error messages. The “Intelligence” section allows you to set an alert for when a certain metric reaches a specified threshold. In my case, I want to know when the number of unique 404 errors has increased by more than 20% over the previous day.

In your custom alert, set the alert’s conditions to include “Event Action,” matching your error’s name exactly. In this case, the error name is “404.” Set it to alert you when the “Unique Events” percentage increases by more than 20% over the previous day. Be sure to check the box for the option to receive an email when this alert triggers!
Once you have captured enough data to analyze, start creating these dashboard widgets and alerts in Google Analytics, so that you can make informed decisions on how to improve your website.
How To Analyze Errors
Error messages will help you see in aggregate the most common stumbling blocks for users. Are a lot of users encountering errors with a particular text field? Perhaps the field for the expiration date of their credit card? Or for their email address? You might be surprised by what your users encounter.
Segmenting Data
If your website gets a lot of traffic, consider segmenting the user base to analyze the error messages. Look for groups of users who make up the majority of a certain kind of error event, because there may be something unique about that segment.
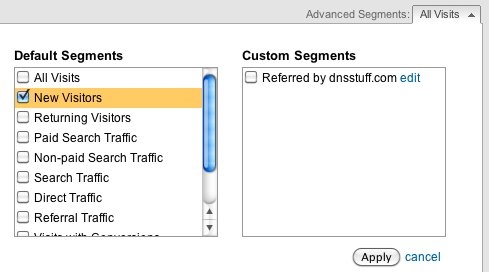
“New Visitors” are first-time visitors to your website. They are likely unfamiliar with the typical flow of your navigation and are brand new to your forms and so don’t know what fields are required. “Returning Visitors” will likely be familiar with your website, so they may not have a large impact on error rates (unless you’ve changed something that catches them by surprise).
To change the user segment that you’re looking at, go to your list of error events and click the drop-down menu next to “Advanced Segments.” By selecting “New Visitors” and then hitting “Apply,” the data will update to show only the errors that “New Visitors” have encountered.

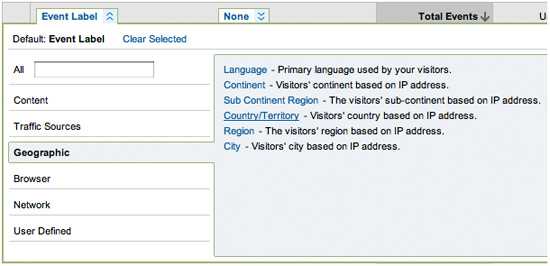
Segmenting users by country can also give more context. I once wrestled with why so many users were triggering error messages for ZIP and postal codes in a form. After organizing the data by country, I saw a high number of errors from one country whose postal-code syntax I hadn’t accounted for in my form’s validation. I fixed the error and saw the error rate for ZIP and postal codes drop.

Referring sources for 404 pages is another way to examine the data. Use the “Filter Event Label” search bar to show errors whose referring source is a particular domain. Searching your own domain first is useful to see which incorrect URLs you can quickly fix on your own website.

Prioritize Issues
After segmenting the data, prioritize the errors that you want to fix. The top priority will be errors that affect a large group of people (i.e. ones that have a high number of unique events). Next, work on the errors that you know you can easily fix. You likely already know the cause of some errors (poor validation, unhelpful error message, etc.), so clean those up. For 404 errors, check which referring links come from your website, and fix those.

Once you’ve cleaned up the errors that are easy to fix, track the new data for at least a week before doing another round of prioritization. Examine what has changed in the top errors and where they come from, and then research the cause of those errors.
Often, forms will need to be made more intuitive to help users avoid error messages. For example, if a lot of users are making mistakes when entering a date, then play with that field. Does your user base prefer drop-down menus for days, months and years? Do they make fewer errors if given a date picker? Are you giving them helpful examples of the syntax they need to follow? Track your changes and measure the rate of error events after each change to see what decreases user error.
Improve Your Error Messages
Improving the text, design and layout of your error messages could decrease the number of repeated errors by users. An error message might not be clear or might be hidden on the page; improve the user experience by testing changes to your error messages.
I prefer A/B testing to compare the effectiveness of error messages and their designs. On one form, I noticed that a number of users were skipping the phone-number field altogether, even though I’d indicated that it was required.

After A/B testing different ways to indicate that the field was required and why it was required, we found that the combination of a link and a tooltip helped users recognize the need to fill in their phone number. This solution drastically decreased the rate of errors for this field.
On 404 pages, test out different content on users: link to your most popular pages; present a search form; try humorous content or Easter eggs to lighten the users’ spirits.
As you test different textual and design changes to your error messages, be sure to measure their effectiveness. Examine the following:
- Total error events, and total events per error message;
- Unique events per error message;
- Exit rates on pages with forms and 404 pages.
All of these rates should drop. Ideally, your users should find the website so intuitive that your error event data will represent only those who try to “beat the system.”
Conclusion
To sum up, track error messages and 404 pages as events in Google Analytics, and analyze the top error patterns. Prioritize the causes of errors, and continue to improve your forms and 404 pages to avoid errors altogether. Lastly, test changes in the content and design of error messages to see whether they decrease repeated errors. Improving your forms, 404 pages and error messages will improve your website’s overall user experience.
Additional Resources
- “Event Tracking Guide,” Google Analytics
- “A Primer on A/B Testing,” A List Apart
- “Optimizing Error Pages: Creating Opportunities Out of Mistakes,” Smashing Magazine
- “Web Form Validation: Best Practices and Examples,” Smashing Magazine
Further Reading
- Website Maintenance Tips for Front-End Developers
- How To Create A Helpful And Better 404 Page
- 404 Error Pages, One More Time
- Optimizing Error Pages: Creating Opportunities Out Of Mistakes


 Agent Ready is the new Headless
 SurveyJS: White-Label Survey Solution for Your JS App


