Revisiting Firefox’s DevTools
If you do any kind of development for the web, then you know how important tools are, and you like finding tools that make your life easier. Developing and testing new browser features, however, takes time. Between the time a useful tool first appears in an experimental nightly build and the time it’s available for everyone to use in Firefox, a while has passed.
That’s one of the reasons Mozilla released Firefox Developer Edition in November 2014 as the recommended Firefox browser for developers. It gets new feature updates more quickly so that you can use the latest tools.
Of course, testing your websites in the standard Firefox release is still crucial. Thankfully, Developer Edition makes this easy by letting you run both programs side by side. Plus, Developer Edition comes with a slick new theme that matches its tools.
A Bit Of History
How far back do we go? Way back in 2001, a debugger called “Venkman” was available for Netscape Navigator version 7. The Netscape corporation had a system for UIs named XML User Interface Language (XUL). It also had a love of the movie “Ghostbusters” and its demonic character Zuul; so, Rob Ginder, who wrote that early debugger, had four options for naming his new debugger, and Venkman beat out Stantz, Spengler and Zeddemore.
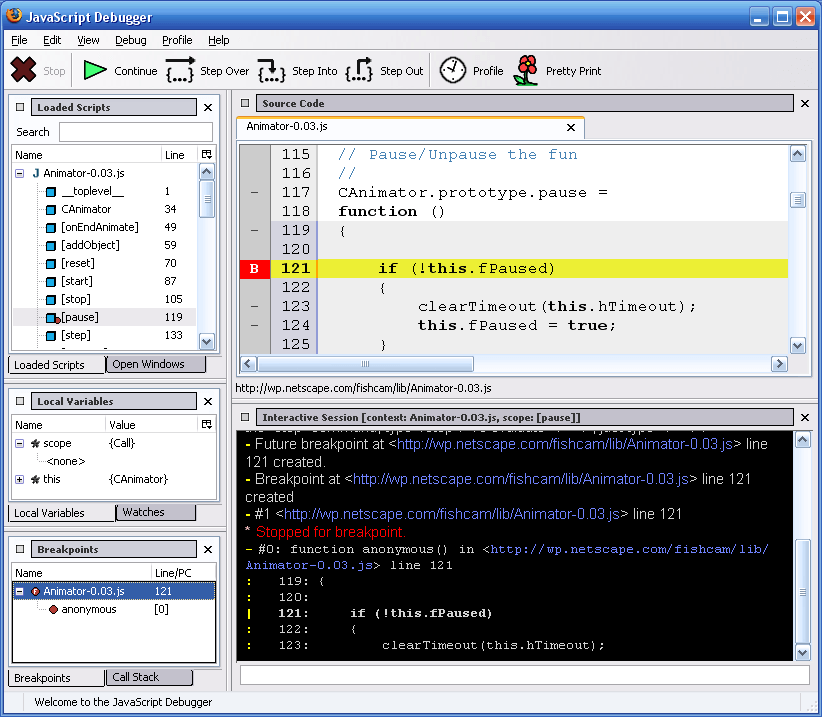
Venkmann was just a JavaScript debugger. It couldn’t inspect the DOM or show network traffic. Netscape had a built-in console, but that was it as far as debugging tools went.
The next piece of the puzzle was the DOM inspector, which was released around 2004 or 2005. It wasn’t friendly to web developers, and it was about debugging XUL as much as HTML.
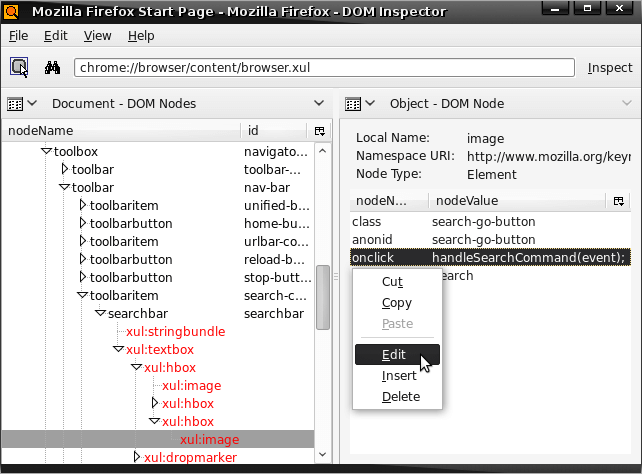
So, in early 2006 Firefox had three pieces of the puzzle: a built-in console, a debugger and a DOM inspector — each separate and not all built in.
In late 2006 Joe Hewitt, who worked on the early release of Firefox, released Firebug version 1.0. Firebug broke new ground in allowing developers to view the DOM and in providing a JavaScript console and debugger and DOM inspector all in the same tool.
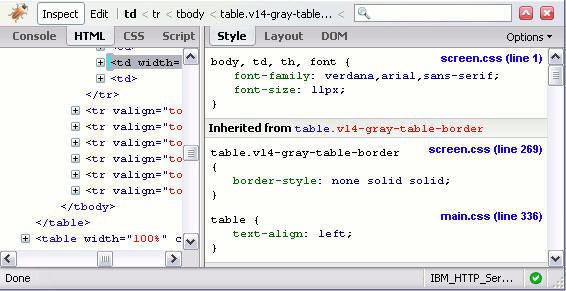
But Firebug was never an official Mozilla project, and with Joe’s departure to Parakey and then Facebook, the development of Firebug was taken up by a group of volunteers led by John J. Barton. Mozilla contributed to the project, supporting Honza Odvarko, who led the project after John left.
In 2011 Mozilla decided that it needed to put more effort into its developer tools and start from a clean slate to build some next-generation tools, while continuing to support the maintenance of Firebug.
One of the challenges with developer tools is that they need to reach deep into the platform to understand how the system works. They need to be a part of the browser and can’t easily be made as add-ons.
So, as Firefox gets updated, keeping Firebug running as a separate add-on becomes harder and harder. Upgrading the debugger APIs, which Firebug needed to keep up with, was significant work, and when the initiative to have separate browser and content processes in Firefox was announced, Mozilla decided to rebuild Firebug on top of the built-in tools.
A Solid Set Of Standard Features
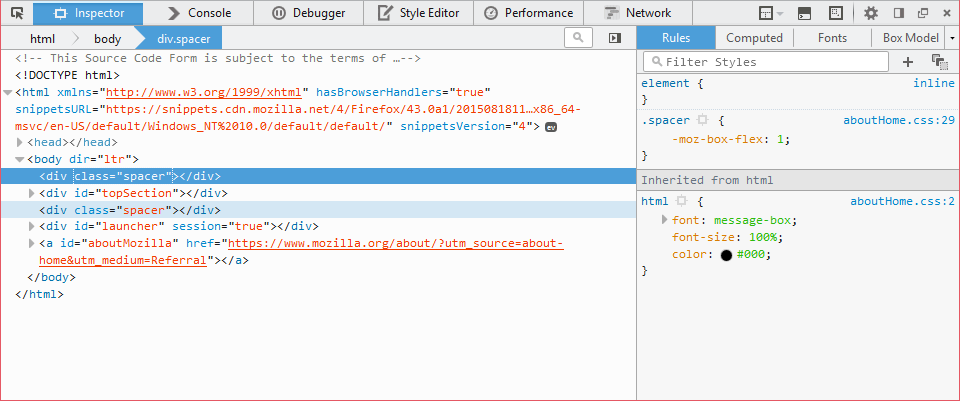
Firefox’s DevTools have come a long way since their inception, quickly bridging the gaps between Firebug and other browsers’ developer tools. It now has all of the tools you’d expect from a browser. Let’s go through some of the main ones.
The page inspector has a a box-model highlighter, a CSS rules editor, a viewer for computed styles, fonts and layout, support for pseudo-elements, and a search tool.
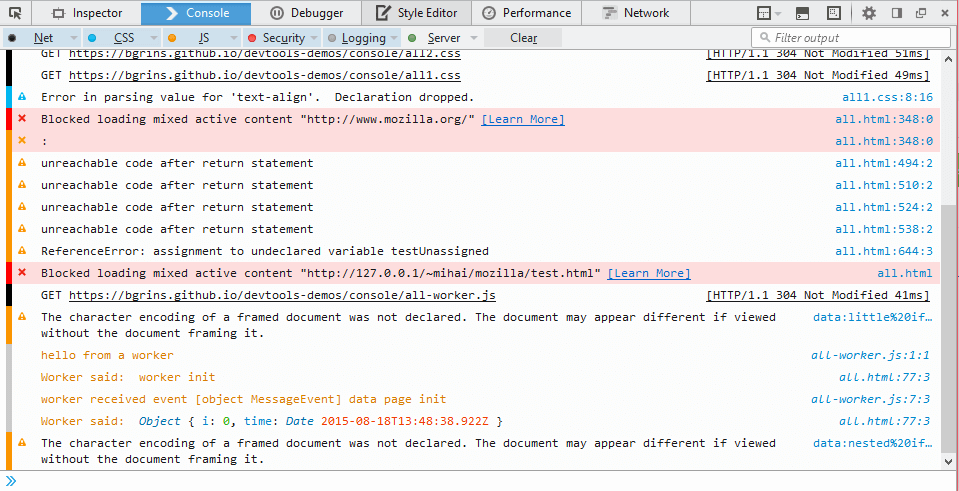
The web console lists JavaScript, CSS, and network and security logs. It supports custom formatting, as well as previews and inspection of DOM nodes, objects and arrays, allowing you to search and filter them.
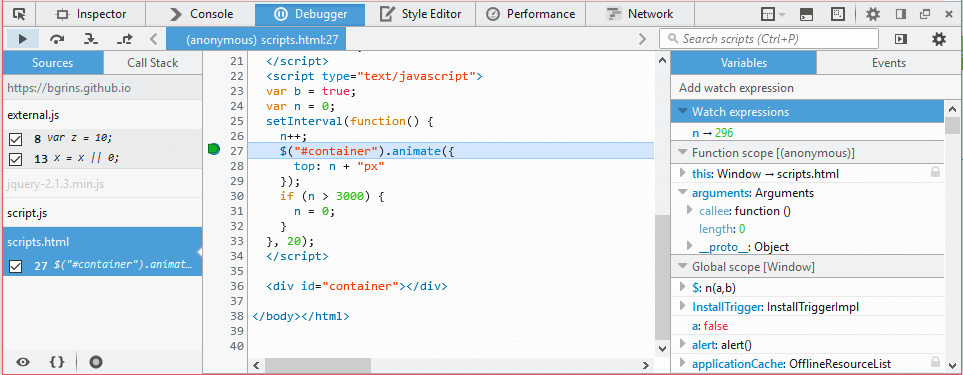
The JavaScript debugger lets you halt the execution of scripts at any point, navigate the call stack and inspect variables. It supports source maps, pretty printing of minified sources, and black boxing of library files. And it supports dynamically evaluated scripts.
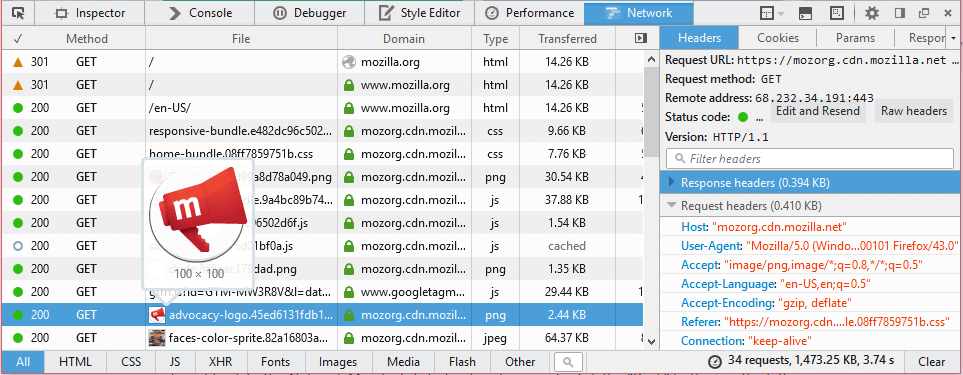
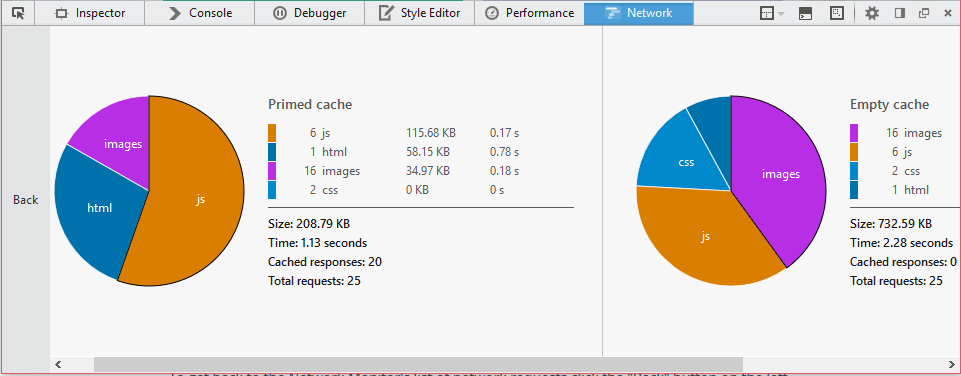
The network monitor lists all requests that Firefox makes for a web page. It displays headers, responses and cookies, letting you search through them. It also shows a performance analysis of the page load.
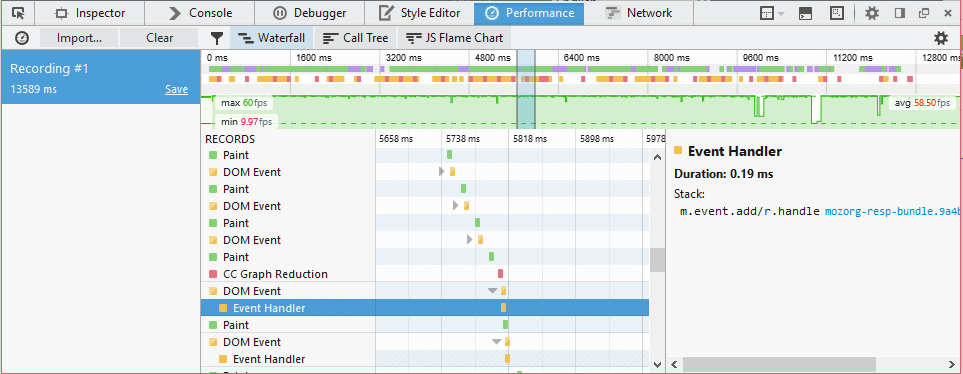
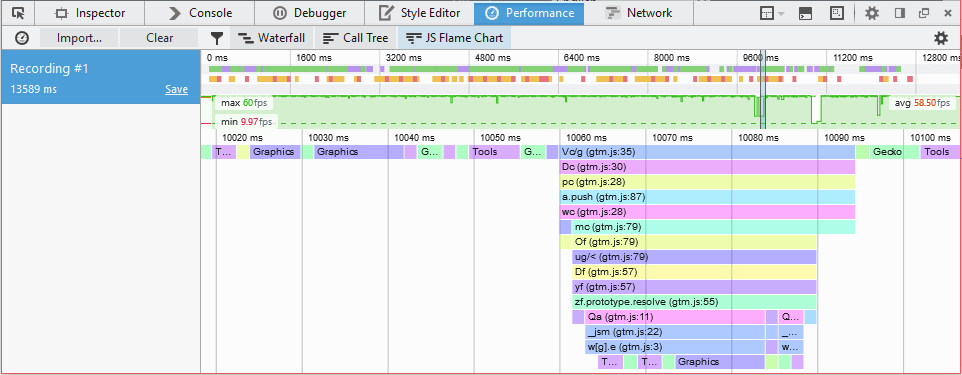
The performance tools give you insight into a website’s JavaScript and layout performance by recording browser activity over time and exposing frame-rate data, memory usage, JavaScript calls and browser-rendering events such as styling, layout and paints.
Some Key Differentiators
On top of the usual set of tools, Firefox has a number of neat features to make your life as a developer or designer easier. We’ll go over some of them now, but download Firefox Developer Edition and try them out for yourself.
Work With Animations
CSS animations and transitions are a great way to improve the UX of a website, but they’re also hard to get right, and they can easily get in the way instead of guiding the user’s flow. If you want your animations to look and feel just right, then you’ll need to spend time finetuning those keyframes, durations and timing functions. Firefox comes with a set of tools to help with just that. Let’s go through a few.
Timing Function
The timing function drives the way that an animation or transition progresses through time. Timing functions are often described with a cubic-bezier curve. Coming up with the perfect curve is not straightforward; so, Firefox’s DevTools comes with a tooltip that allows you to modify a curve visually or even choose from a list of presets.
CSS animations are described with a set of @keyframe rules. Firefox displays these keyframe rules in the view for CSS rules when the selected element is animated, so that you can directly edit them there, where you’d expect. You can even edit keyframe properties while an animation is playing.
Animation Inspector
The animation inspector allows you to view all individual animations on a page, detect when they get added or removed, as well as pause them at any point, slow them down or speed them up. It’s a powerful feature for looking at animations in detail.
Test On Multiple Devices, Browsers And Screens
When it comes to making sure a website displays correctly for everyone, things are a lot more complex than they used to be. We now have to deal with many aspect ratios and pixel densities, as well as many browsers on all sorts of operating systems and devices. Thankfully, Firefox comes with tools just for this.
Responsive Design View
The responsive design view makes it really easy to see how a website looks at different screen sizes. Either choose a size from the list of presets or adjust the size to anything you want by entering custom dimensions or dragging the viewport. The responsive design view can quickly be toggled from the keyboard (Command + Alt + M or Control + Shift + M) or by clicking the corresponding icon in the DevTools toolbar.
Valence
Valence is an add-on that comes preinstalled with Firefox’s WebIDE. WebIDE already allows you to connect Firefox’s DevTools to any website or app on Firefox OS and in Firefox for Android. Now, with Valence, you can also connect the tools to Chrome on Android and the desktop and to Safari on iOS and Mac OS X. Valence gives you pretty much all you need for multi-browser testing without having to leave the DevTools you’re used to.
Developer Toolbar
The developer toolbar (GCLI) has a handy media command that’s useful for emulating any media type in the browser. It’s very useful for testing your website’s print CSS, for instance.
Discover, Use And Understand Complex CSS Features
CSS can be complex. Some strings of syntax are hard to remember, some you might not even know about, and others, even ones you know of, have effects that are hard to predict. Firefox’s DevTools, being built into the browser, are ideally positioned to give you all of the information necessary to work with the syntax. Let’s see some examples.
CSS Properties Tooltips
The CSS properties tooltips help you remember the different values and syntax constructions that properties can have. Firefox makes it super-easy to get documentation for any CSS property directly in the tools where you need it. Right-click on any property’s name in the CSS rules editor to get documentation in a tooltip, with a list of possible values and documentation about them, too.
CSS Transforms Previewer
The CSS transforms previewer helps you understand how a given set of transform functions have changed an element. The transform property is the sort of CSS property that is hard to get right just by looking at the code; a visual rendering of what has happened is usually much better. The CSS transform previewer highlights the element as it was before and after it got transformed, so that you can easily see the effect of the transformation.
CSS Filter Tooltip
Filters are a relatively new feature in CSS and really powerful. With them, you can blur, add shadow or rotate the colors of any element simply. Writing a valid CSS filter function isn’t the easiest thing in the world, and you can chain as many functions as you want, so Firefox’s DevTools has a handy tooltip that allows you to create filters in a simple and visual way.
Miscellaneous Tips And Tricks
Ever need to take a screenshot of all or part of a page? Capturing web pages or parts of web pages as images is a powerful way to show a design or a bug to other people. Doing this in Firefox is easy, either by right-clicking on any node in the page inspector or by using the full-page screenshot button in the toolbar (make sure it’s enabled in the options panel first).
Eyedropper Tool
The eyedropper tool is useful for sampling any color from a page. If you need to copy the color of any part of a web page or want to change the color on an element’s CSS property, then use the eyedropper. In the CSS rules view, with an element selected, click on the color swatch next to any color property’s value to change it. Or, in the developer menu bar, choose the eyedropper item to copy colors from the page.
Highlight all elements that match a selector by clicking on the selector icon in the CSS rules view.
CSS Rules View Search Bar
Filter styles using the CSS rules view search bar. This might be helpful if you’re not sure which property has overridden another.
Closing Words
Firefox’s DevTools have evolved quite rapidly in recent years, and feature-packed versions are now getting released every six weeks. The project is being driven by an active community, which you can be a part of!
Feel free to download Firefox Developer Edition to try out the latest version of the tools. And stay up to date on new features at Mozilla Hacks.
Further Reading
- What’s New In DevTools?
- What’s New With DevTools: Cross-Browser Edition
- DevTools Debugging Tips And Shortcuts (Chrome, Firefox, Edge)
- A Guide To New And Experimental CSS DevTools In Firefox


 Try if for free!
 Register for free today!

 JavaScript Form Builder — Create JSON-driven forms without coding.
 Get a Free Trial

