Bringing Together React, D3, And Their Ecosystem
Since its creation in 2011, D3.js has become the de facto standard for building complex data visualizations on the web. React is also quickly maturing as the library of choice for creating component-based user interfaces.
Both React and D3 are two excellent tools designed with goals that sometimes collide. Both take control of user interface elements, and they do so in different ways. How can we make them work together while optimizing for their distinct advantages according to your current project?
In this post, we will see how we can approach building React projects that need the powerful charting goodness of D3. We will discover different techniques and how to choose the best library for your needs in your main work and side projects.
D3 And The DOM
The D3 in D3.js stands for data-driven documents. D3.js is a low-level library that provides the building blocks necessary to create interactive visualizations. It uses web standards such as SVG, HTML, canvas, and CSS to assemble a front-end toolbox with a vast API and almost limitless control over the look and behavior of visualizations. It also provides several mathematical functions that help users to calculate complex SVG paths.
How Does It Work?
In a nutshell, D3.js loads data and attaches it to the DOM. Then, it binds that data to DOM elements and transforms those elements, transitioning among states if necessary.
D3.js selections are similar to jQuery objects, because they help us deal with SVG complexity. The way this is done is comparable to the way jQuery deals with HTML DOM elements. Both libraries also share a similar chain-based API and the use of the DOM as data storage.
Data Joins
Data joins, as explained in Mike Bostocks’ article “Thinking with Joins,” are the process by which D3 links data to DOM elements through the use of selections.
Data joins help us match the data we provide to already created elements, add items that are missing and remove elements that are no longer needed. They use D3.js selections, which, when combined with data, split the selected elements into three different groups: elements that need to be created (the enter group), elements that need to be updated (the update group) and elements that need to be removed (the exit group).
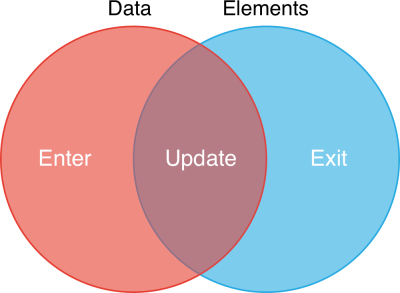
In practice, a JavaScript object with two arrays represents a data join. We can trigger operations on the enter and exit groups by calling the enter and exit methods of the selection, while we can directly operate on the update group in the latest version of D3.js.
As described by Bostock, with data joins, “you can visualize real-time data, allow interactive exploration, and transition smoothly between datasets.” They are effectively a diff algorithm, similar to the way React manages the rendering of child elements, as we will see in the following sections.
D3 Libraries
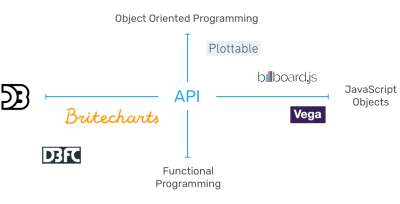
The D3 community hasn’t found a standard way to create components from D3 code, which is a frequent need because D3.js is remarkably low-level. We could say that there are almost as many encapsulating patterns as D3-based libraries, although I am going to classify them — through their API — into four groups: object-oriented, declarative, functional, and chained (or D3-like).
I have done some research on the D3.js ecosystem and selected a small, high-quality subset. They are up-to-date libraries with D3.js version 4 and with good test coverage. They differ in the type of API and granularity of their abstractions.
Plottable
Plottable is a popular object-oriented charting library that features low granularity; so, we need to set up axes, scales and plots manually to compose charts. You can see an example here.

Billboard
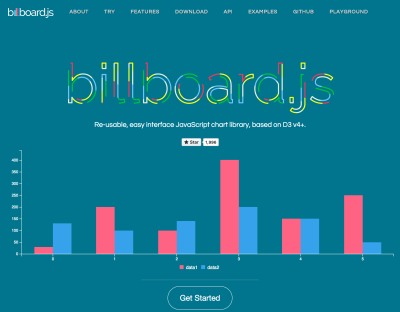
Billboard is a fork of the famous C3.js library, updated with D3.js version 4 compatibility and aimed to give continuity to this classic library. It is written using ECMAScript 6 and new modern tooling such as Webpack. Its API is based on configuration objects passed to charts, so we could say it is a declarative API.
Vega
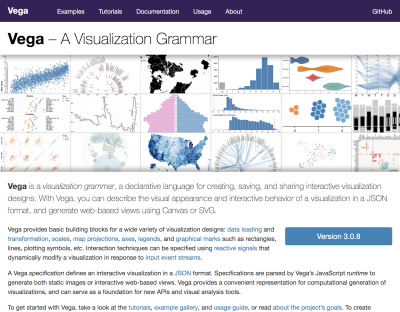
Vega takes the declarative path a bit further, evolving the configurations from JavaScript objects into pure JSON files. It aims to implement a visualization grammar inspired by The Grammar of Graphics, a book by Leland Wilkinson that formalizes the building blocks of data visualizations and that was an inspiration for D3.js as well. You can play with its editor, selecting one of the examples as a starting point.
D3FC
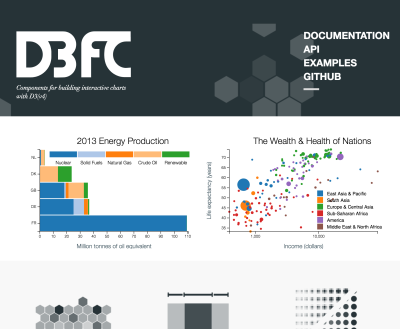
D3FC makes use of D3.js and custom building blocks to help you create powerful interactive charts both in SVG and canvas. It features a functional, low-granularity interface and a large amount of D3.js code, so, though powerful, it probably takes some learning. Check out its examples.
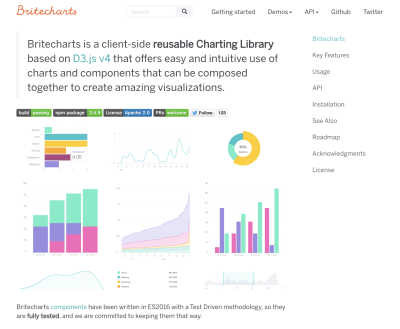
Britecharts
Britecharts — a library created by Eventbrite, of which I am a core contributor — makes use of the Reusable Chart API, an encapsulation pattern popularized by Mike Bostock in his post “Towards Reusable Charts” and employed in other libraries such as NVD3. Britecharts creates a high-level abstraction, making it easy to create charts, while keeping a low complexity on the inside, allowing D3 developers to customize Britecharts for their use. We spent a lot of time building a polished UI and many approachable demos.
Summarizing the libraries by their APIs, we could represent them like this:
React And The DOM
React is a JavaScript library that helps us build user interfaces by composing components. These components keep track of their state and pass in properties to re-render themselves effectively, optimizing the performance of the application.
How Does It Work?
The virtual DOM, which is a representation of the DOM’s current state, is the technology that enables React’s re-rendering optimizations. The library uses a complex diff algorithm to understand which parts of the application need to re-render when the conditions change. This diff algorithm is called the “reconciliation algorithm.”
Dynamic Child Components
When rendering components that contain a list of items, developers need to use a unique “key” property attached to the child components. This value helps the diff algorithm to figure out if the item needs to be re-rendered when new data — or state, as it is called in the React world — is passed to the component. The reconciliation algorithm checks the values of the keys to see whether the item needs to be added or removed. Does this feel familiar after learning about D3.js’ data joins?
Since version 0.14, React also keeps the renderer in a separate module. This way, we can use the same components to render in different mediums, such as native applications (React Native), virtual reality (React VR) and the DOM (react-dom). This flexibility is similar to the way D3.js code can be rendered in different contexts, such as SVG and canvas.
React And D3.js
Both React and D3 share the goal of helping us deal with the DOM and its complexity in a highly optimized way. They also share a preference for pure functions — code that, for a given input, always returns the same output without incurring side effects — and stateless components.
However, the shared concern about the DOM makes these two opinionated libraries clash when determining which is to render and animate the user interface elements. We are going to see different ways to solve this dispute, and that there is no easy answer. We could establish a hard rule, though: They should never share DOM control. That would be a recipe for disaster.
Approaches
When integrating React and D3.js, we can do so at different levels, leaning more on the D3.js side or the React side. Let’s see our four main choices.
D3.js Within React
The first approach we can follow is to give our D3 code as much DOM control as possible. It employs a React component to render an empty SVG element that works as the root element of our data visualization. Then it uses the componentDidUpdate lifecycle method to, using that root element, create the chart using the D3.js code we would employ in a vanilla JavaScript scenario. We could also block any further component updates by making the shouldComponentUpdate method to always return false.
class Line extends React.Component {

    static propTypes = {...}

    componentDidMount() {
        // D3 Code to create the chart
        // using this._rootNode as container
    }

    shouldComponentUpdate() {
        // Prevents component re-rendering
        return false;
    }

    _setRef(componentNode) {
        this._rootNode = componentNode;
    }

    render() {
        <div className="line-container" ref={this._setRef.bind(this)} />
    }
}
Evaluating this approach, we recognize that it offers some benefits and drawbacks. Among the benefits, this is a simple solution that works fine most of the time. It is also the most natural solution when you are porting existing code into React, or when you are using D3.js charts that were already working somewhere else.
On the downside, mixing both React code and D3.js code within a React component could be seen as a bit gross, incorporating too many dependencies and making that file too long to be considered quality code. Also, this implementation doesn’t feel React-idiomatic at all. Lastly, because the React render server does not call the componentDidUpdate method, we cannot ship a rendered version of the chart in the initial HTML.
React Faux DOM
Implemented by Oliver Caldwell, React Faux DOM “is a way to use existing D3 tooling but render it through React in the React ethos.” It uses a fake DOM implementation to trick D3.js into thinking it is dealing with a real DOM. This way, we keep the React DOM tree while using D3.js in — almost — all its potential.
import {withFauxDOM} from 'react-faux-dom'

class Line extends React.Component {

    static propTypes = {...}

    componentDidMount() {
        const faux = this.props.connectFauxDOM('div', 'chart');

        // D3 Code to create the chart
        // using faux as container
        d3.select(faux)
            .append('svg')
        {...}
    }

    render() {
        <div className="line-container">
           {this.props.chart}
        </div>
    }
}

export default withFauxDOM(Line);
An advantage of this approach is that it allows you to use most of the D3.js APIs, making it easy to integrate with already-built D3.js code. It also allows for server-side rendering. A shortcoming of this strategy is that it is less performant, because we are placing another fake DOM implementation before React’s virtual DOM, virtualizing the DOM twice. This issue limits its use to small and medium-sized data visualizations.
Lifecycle Methods Wrapping
This approach, first stated by Nicolas Hery, makes use of the lifecycle methods present in class-based React components. It elegantly wraps the creation, update and removal of D3.js charts, establishing a sharp boundary between React and D3.js code.
import D3Line from './D3Line'

class Line extends React.Component {

    static propTypes = {...}

    componentDidMount() {
        // D3 Code to create the chart
        this._chart = D3Line.create(
            this._rootNode,
            this.props.data,
            this.props.config
        );
    }

    componentDidUpdate() {
        // D3 Code to update the chart
        D3Line.update(
           this._rootNode,
           this.props.data,
           this.props.config,
           this._chart
        );
    }

    componentWillUnmount() {
        D3Line.destroy(this._rootNode);
    }

    _setRef(componentNode) {
        this._rootNode = componentNode;
    }

    render() {
        <div className="line-container" ref={this._setRef.bind(this)} />
    }
}
The D3Line is something like this:
const D3Line = {};

D3Line.create = (el, data, configuration) => {
    // D3 Code to create the chart
};

D3Line.update = (el, data, configuration, chart) => {
    // D3 Code to update the chart
};

D3Line.destroy = () => {
    // Cleaning code here
};

export default D3Line;
Coding this way produces a lightweight React component that communicates with a D3.js-based chart instance through a simple API (create, update and remove), pushing downward any callback methods we want to listen.
This strategy promotes a clear separation of concerns, using a facade to hide the implementation details of the chart. It could encapsulate any graph, and the generated interface is simple. Another benefit is that it is easy to integrate with any already-written D3.js code, and it allows us to use D3.js’ excellent transitions. The main drawback of this method is that server-side rendering is not possible.
React For The DOM, D3 For Math
In this strategy, we limit the use of D3.js to the minimum. This means performing calculations for SVG paths, scales, layouts and any transformations that take user data and transforms it into something we can draw with React.
Using D3.js just for the math is possible thanks to a large number of D3.js sub-modules that don’t relate to the DOM. This path is the most React-friendly, giving the Facebook library full ruling over the DOM, something it does remarkably well.
Let’s see a simplified example:
class Line extends React.Component {

    static propTypes = {...}

    drawLine() {
        let xScale = d3.scaleTime()
            .domain(d3.extent(this.props.data, ({date}) => date));
            .rangeRound([0, this.props.width]);

        let yScale = d3.scaleLinear()
            .domain(d3.extent(this.props.data, ({value}) => value))
            .rangeRound([this.props.height, 0]);

        let line = d3.line()
            .x((d) => xScale(d.date))
            .y((d) => yScale(d.value));

        return (
            <path
                className="line"
                d={line(this.props.data)}
            />
        );
    }

    render() {
        <svg
           className="line-container"
           width={this.props.width}
           height={this.props.height}
        >
           {this.drawLine()}
        </svg>
    }
}
This technique is the favorite of seasoned React developers because it is consistent with the React way. Also, once it is put in place, building charts with its code feels great. Another benefit would be rendering on the server side, and possibly React Native or React VR.
Paradoxically, this is the approach that requires more knowledge about how D3.js works, because we need to integrate with its sub-modules at a low level. We must re-implement some D3.js functionality — axes and shapes the more common; brushes, zooms and dragging probably the hardest — and this implies a significant amount of up-front work.
We would also need to implement all of the animations. We have great tools in the React ecosystem that allows us to manage animations — see react-transition-group, react-motion, and react-move — although none of them enable us to create complex interpolations of SVG paths. One question pending would be how this approach can be leveraged to render charts using HTML5’s canvas element.
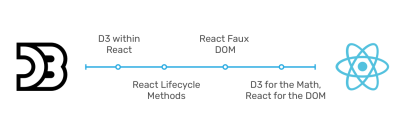
In the following diagram, we can see all of the described approaches according to the level of integration with both React and D3.js:
React-D3.js Libraries
I have done some research on D3.js-React libraries that hopefully will help you when you’re facing the decision of choosing a library to work with, contribute or fork. It contains some subjective metrics, so please take it with a grain of salt.
This research revealed that, although there are many libraries, not many of them are being maintained. As a maintainer myself, I can understand how hard it is to keep up with changes in one major library and how having to look after two would be a daunting task.
Also, the number of production-ready libraries (from version 1.0.0 and up) is still pretty low. It probably has to do with the amount of work necessary to ship a library of this type.
Let’s see some of my favorites.
Victory
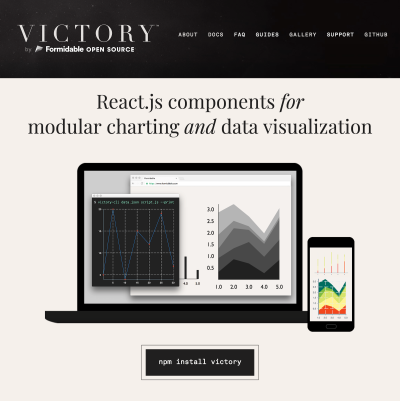
A project by the consultancy company Formidable Labs, Victory is a low-level component library of chart elements. Due to that low-level characteristic, Victory components can be put together with different configurations to create complex data visualizations. Under the hood, it reimplements D3.js features such as the brush and zoom, although it uses d3-interpolate for animations.
Using it for a line chart would look like this:
class LineChart extends React.Component {
    render() {
        return (
            <VictoryChart
                height={400}
                width={400}
                containerComponent={<VictoryVoronoiContainer/>}
            >
                <VictoryGroup
                    labels={(d) => `y: ${d.y}`}
                    labelComponent={
                        <VictoryTooltip style={{ fontSize: 10 }} />
                    }
                    data={data}
                >
                    <VictoryLine/>
                    <VictoryScatter size={(d, a) => {return a ? 8 : 3;}} />
                </VictoryGroup>
            </VictoryChart>
        );
    }
}
That produces a line chart like this:

Getting started with Victory is easy, and it has some nice bonuses, like the zoom and the Voronoi container for tooltips. It is a trendy library, although it is still in a pre-release state and has a large number of bugs pending. Victory is the only library at the moment that you can use with React Native.
Recharts
Aesthetically polished, with an enjoyable user experience, smooth animations and a great-looking tooltip, Recharts is one of my favorite React-D3.js libraries. Recharts only makes use of d3-scale, d3-interpolate and d3-shape. It offers a higher level of granularity than Victory, limiting the amount of data visualizations we can compose.
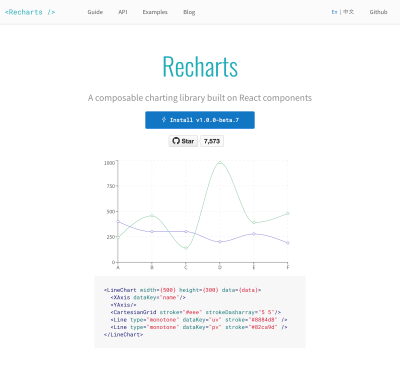
Using Recharts looks like this:
class LineChart extends React.Component {
    render () {
        return (
            <LineChart
                width={600}
                height={300}
                data={data}
                margin={{top: 5, right: 30, left: 20, bottom: 5}}
            >
                <XAxis dataKey="name"/>
                <YAxis/>
                <CartesianGrid strokeDasharray="3 3"/>
                <Tooltip/>
                <Legend />
                <Line type="monotone" dataKey="pv" stroke="#8884d8" activeDot={{r: 8}}/>
                <Line type="monotone" dataKey="uv" stroke="#82ca9d" />
            </LineChart>
        );
    }
}
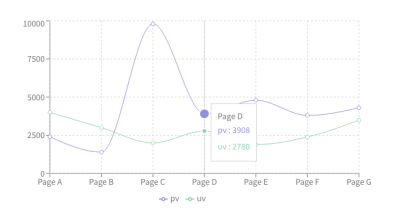
This library is also really well tested, and although still in beta, it features some of the usual charts, a radar chart, tree maps and even brushes. You can check its examples to see more. The developers contributing to this project put serious work into it, achieving smooth animations with their animation project react-smooth.
Nivo
Nivo is a high-level React-D3.js charting library. It offers a lot of options for rendering: SVG, canvas, even an API-based HTML version of the charts that is ideal for server-side rendering. It uses React Motion for animations.
Its API is a bit different, because it reveals only one configurable component for each chart. Let’s see an example:
class LineChart extends React.Component {
    render () {
        return (
            <ResponsiveLine
                data={data}
                margin={{
                    "top": 50,
                    "right": 110,
                    "bottom": 50,
                    "left": 60
                }}
                minY="auto"
                stacked={true}
                axisBottom={{
                    "orient": "bottom",
                    "tickSize": 5,
                    "tickPadding": 5,
                    "tickRotation": 0,
                    "legend": "country code",
                    "legendOffset": 36,
                    "legendPosition": "center"
                }}
                axisLeft={{
                    "orient": "left",
                    "tickSize": 5,
                    "tickPadding": 5,
                    "tickRotation": 0,
                    "legend": "count",
                    "legendOffset": -40,
                    "legendPosition": "center"
                }}
                dotSize={10}
                dotColor="inherit:darker(0.3)"
                dotBorderWidth={2}
                dotBorderColor="#ffffff"
                enableDotLabel={true}
                dotLabel="y"
                dotLabelYOffset={-12}
                animate={true}
                motionStiffness={90}
                motionDamping={15}
                legends={[
                    {
                        "anchor": "bottom-right",
                        "direction": "column",
                        "translateX": 100,
                        "itemWidth": 80,
                        "itemHeight": 20,
                        "symbolSize": 12,
                        "symbolShape": "circle"
                    }
                ]}
            />
        );
    }
}
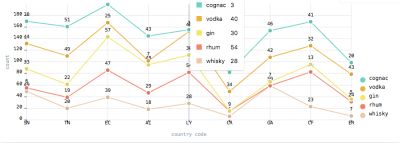
Raphael Benitte did an astounding job with Nivo. The documentation is lovely and its demos configurable. Due to the higher abstraction level of this library, it is super-simple to use, and we could say that it offers less potential for visualization creation. A nice feature of Nivo is the possibility to use SVG patterns and gradients to fill in your charts.
VX
VX is a collection of low-level visualization components for creating visualizations. It is unopinionated and is supposed to be used to produce other charting libraries or as is.
Let’s see some code:
class VXLineChart extends React.Component {
    render () {
        let {width, height, margin} = this.props;

        // bounds
        const xMax = width - margin.left - margin.right;
        const yMax = height - margin.top - margin.bottom;

        // scales
        const xScale = scaleTime({
        range: [0, xMax],
        domain: extent(data, x),
        });
        const yScale = scaleLinear({
        range: [yMax, 0],
        domain: [0, max(data, y)],
        nice: true,
        });

        return (
            <svg
                width={width}
                height={height}
            >
                <rect
                    x={0}
                    y={0}
                    width={width}
                    height={height}
                    fill="white"
                    rx={14}
                />
                <Group top={margin.top}>
                    <LinePath
                        data={data}
                        xScale={xScale}
                        yScale={yScale}
                        x={x}
                        y={y}
                        stroke='#32deaa'
                        strokeWidth={2}
                    />
                </Group>
            </svg>
        );
    }
};
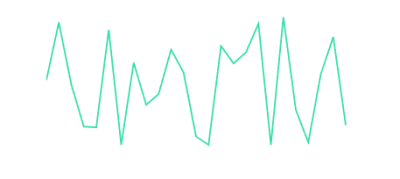
Given this low-level granularity, I think of VX as a D3.js for the React world. It is agnostic about the animation library the user wants to use. Right now, it is still in early beta, although it is being used in production by Airbnb. Its deficits at this moment are the lack of support for interactions such as brushing and zooming.
Britecharts React
Britecharts React is still in beta, and it’s the only one of these libraries that uses the lifecycle method-wrapping approach. It aims to allow use of Britecharts visualizations in React by creating an easy-to-use code wrapper.
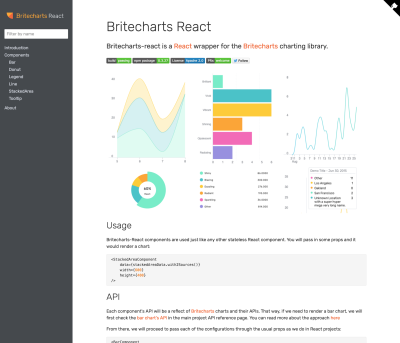
Here is simple code for a line chart:
class LineChart extends React.Component {
    render () {
        const margin = {
            top: 60,
            right: 30,
            bottom: 60,
            left: 70,
        };

        return (
            <TooltipComponent
                data={lineData.oneSet()}
                topicLabel="topics"
                title="Tooltip Title"
                render={(props) => (
                    <LineComponent
                        margin={margin}
                        lineCurve="basis"
                        {...props}
                    />
                )}
            />
        );
    }
}
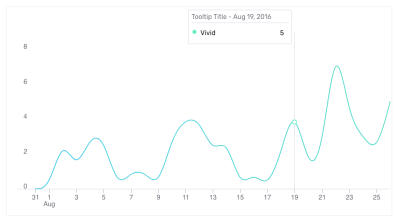
I can’t be objective about this one. Britecharts React could be used as scaffold to render your D3.js charts as React components. It doesn’t support server-side rendering, although we have included loading states to overcome this in some way.
Feel free to check the online demos and play with the code.
Choosing An Approach Or Library
I have grouped the considerations in building applications with charts into four categories: quality, time, scope and cost. They are too many, so we should simplify.
Let’s say we fix quality. We could aim to have a code base that is well tested, up to date with D3.js version 4 and with comprehensive documentation.
If we think about time, a useful question to ask ourselves is, “Is this a long-term investment?” If the response is “yes,” then I would advise you to create a library based on D3.js and wrap it with React using the lifecycle methods approach. This approach separates our code by technologies and is more time-resistant.
If, on the contrary, the project has tight deadlines and the team does not need to maintain it for a long time, I would advise grabbing the React-D3.js or D3.js library closest to the specifications, fork it and use it, trying to contribute along the way.
When we deal with scope, we should think of whether what we need is a small number of basic charts, a one-off complex visualization or several highly customized graphics. In the first case, I would again choose the closest library to the specifications and fork it. For bespoke data visualizations that contain a lot of animations or interactions, building with regular D3.js is the best option. Lastly, if you plan to use different charts with particular specifications — perhaps with the support of UX’ers and designers — then creating your D3 library from scratch or forking and customizing an existing library would work best.
Finally, the cost side of the decision is related to the budget and training of the team. What kinds of skills does your team have? If you have D3.js developers, they would prefer a clear separation between D3.js and React, so probably an approach using the lifecycle method wrapping would work great. However, if your team is mostly React developers, they would enjoy extending any of the current React-D3.js libraries. Also, using the lifecycle methods along with D3.js examples could work. What I rarely recommend is rolling your own React-D3.js library. The amount of work necessary up front is daunting, and the updating paces of both libraries make the maintenance costs non-trivial.
Summary
React and D3.js are great tools to help us deal with the DOM and its challenges. They can surely work together, and we are empowered to choose where to draw the line between them. A healthy ecosystem of libraries exists to help us use D3.js. A lot of exciting options are there for React-D3.js, too, and both libraries are in constant evolution, so projects combining both will have a hard time keeping up.
Choosing will depend on so many variables that can’t all be accounted for in a single article. However, we covered most of the principal considerations, hopefully empowering you to make your own informed decision.
With this foundation, I encourage you to get curious, check the libraries mentioned and add some charting goodness to your projects.
Have you used any of these projects? If you have, what was your experience? Share some words with us in the comments.
Further Reading
- Exploring The Potential Of Web Workers For Multithreading On The Web
- How We Optimized Performance To Serve A Global Audience
- A Guide To Redux Toolkit With TypeScript
- How To Build Server-Side Rendered (SSR) Svelte Apps With SvelteKit


 SurveyJS: White-Label Survey Solution for Your JS App
 Agent Ready is the new Headless


