How To Benchmark And Improve Web Vitals With Real User Metrics

Email Newsletter
Weekly tips on front-end & UX.
Trusted by 182,000+ folks.
This article has been kindly supported by our dear friends at Raygun who help developers identify issues before their customers are impacted, providing the standard of experience that users expect and deserve. Thank you!
How would you measure performance? Sometimes it’s the amount of time an application takes from initial request to fully rendered. Other times it’s about how fast a task is performed. It may also be how long it takes for the user to get feedback on an action. Rest assured, all these definitions (and others) would be correct, provided the right context.
Unfortunately, there is no silver bullet for measuring performance. Different products will have different benchmarks and two apps may perform differently against the same metrics, but still rank quite similarly to our subjective “good” and “bad” verdicts.
In an effort to streamline language and to promote collaboration and standardization, our industry has come up with widespread concepts. This way developers are capable of sharing solutions, defining priorities, and focusing on getting work done effectively.
Performance vs Perceived Performance
Take this snippet as an example:
const sum = new Array(1000)
  .fill(0)
  .map((el, idx) => el + idx)
  .reduce((sum, el) => sum + el, 0)
console.log(sum)
The purpose of this is unimportant, and it doesn’t really do anything except take a considerable amount of time to output a number to the console. Facing this code, one would (rightfully) say it does not perform well. It’s not fast code to run, and it could be optimized with different kinds of loops, or perform those tasks in a single loop.
Another important thing is that it has the potential to block the rendering of a web page. It freezes (or maybe even crashes) your browser tab. So in this case, the performance perceived by the user is hand in hand with the performance of the task itself.
However, we can execute this task in a web worker. By preventing render block, our task will not perform any faster— so one could say performance is still the same — but the user will still be able to interact with our app, and be provided with proper feedback. That impacts how fast our end-user will perceive our application. It is not faster, but it has better Perceived Performance.
Note: Feel free to explore my react-web-workers proof-of-concept on GitHub if you want to know more about Web-Workers and React.
Web Vitals
Web performance is a broad topic with thousands of metrics that you could potentially monitor and improve. Web Vitals are Google’s answer to standardizing web performance. This standardization empowers developers to focus on the metrics that have the greatest impact on the end-user experience.
- First Contentful Paint (FCP)
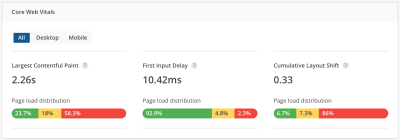
The time from when loading starts to when content is rendered on the screen. - Largest Contentful Paint (LCP)
The render time of the largest image or text block is visible within the viewport. A good score is under 2.5s for 75% of page loads. - First Input Delay (FID)
The time from when the user interacts with the page to the time the browser is able to process the request.
A good score is under 100ms for 75% of page loads. - Cumulative Layout Shift (CLS)
The total sum of all individual layout shifts for every unexpected shift that occurs in the page’s lifespan. A good score is 0.1 on 75% of page loads. - Time to Interactive (TTI)
The time from when the page starts loading to when its main sub-resources have loaded. - Total Blocking Time (TBT)
The time between First Contentful Paint and Time to Interactive where the main thread was blocked (no responsiveness to user input).
"Which one of these is the most important?
Core Web Vitals are the subset of Web Vitals that Google has identified as having the greatest impact on the end-user experience. As of 2022, there are three Core Web Vitals — Largest Contentful Paint (speed), Cumulative Layout Shift (stability) and First Input Delay (interactivity)."
Recommended Reading: The Developer’s Guide to Core Web Vitals
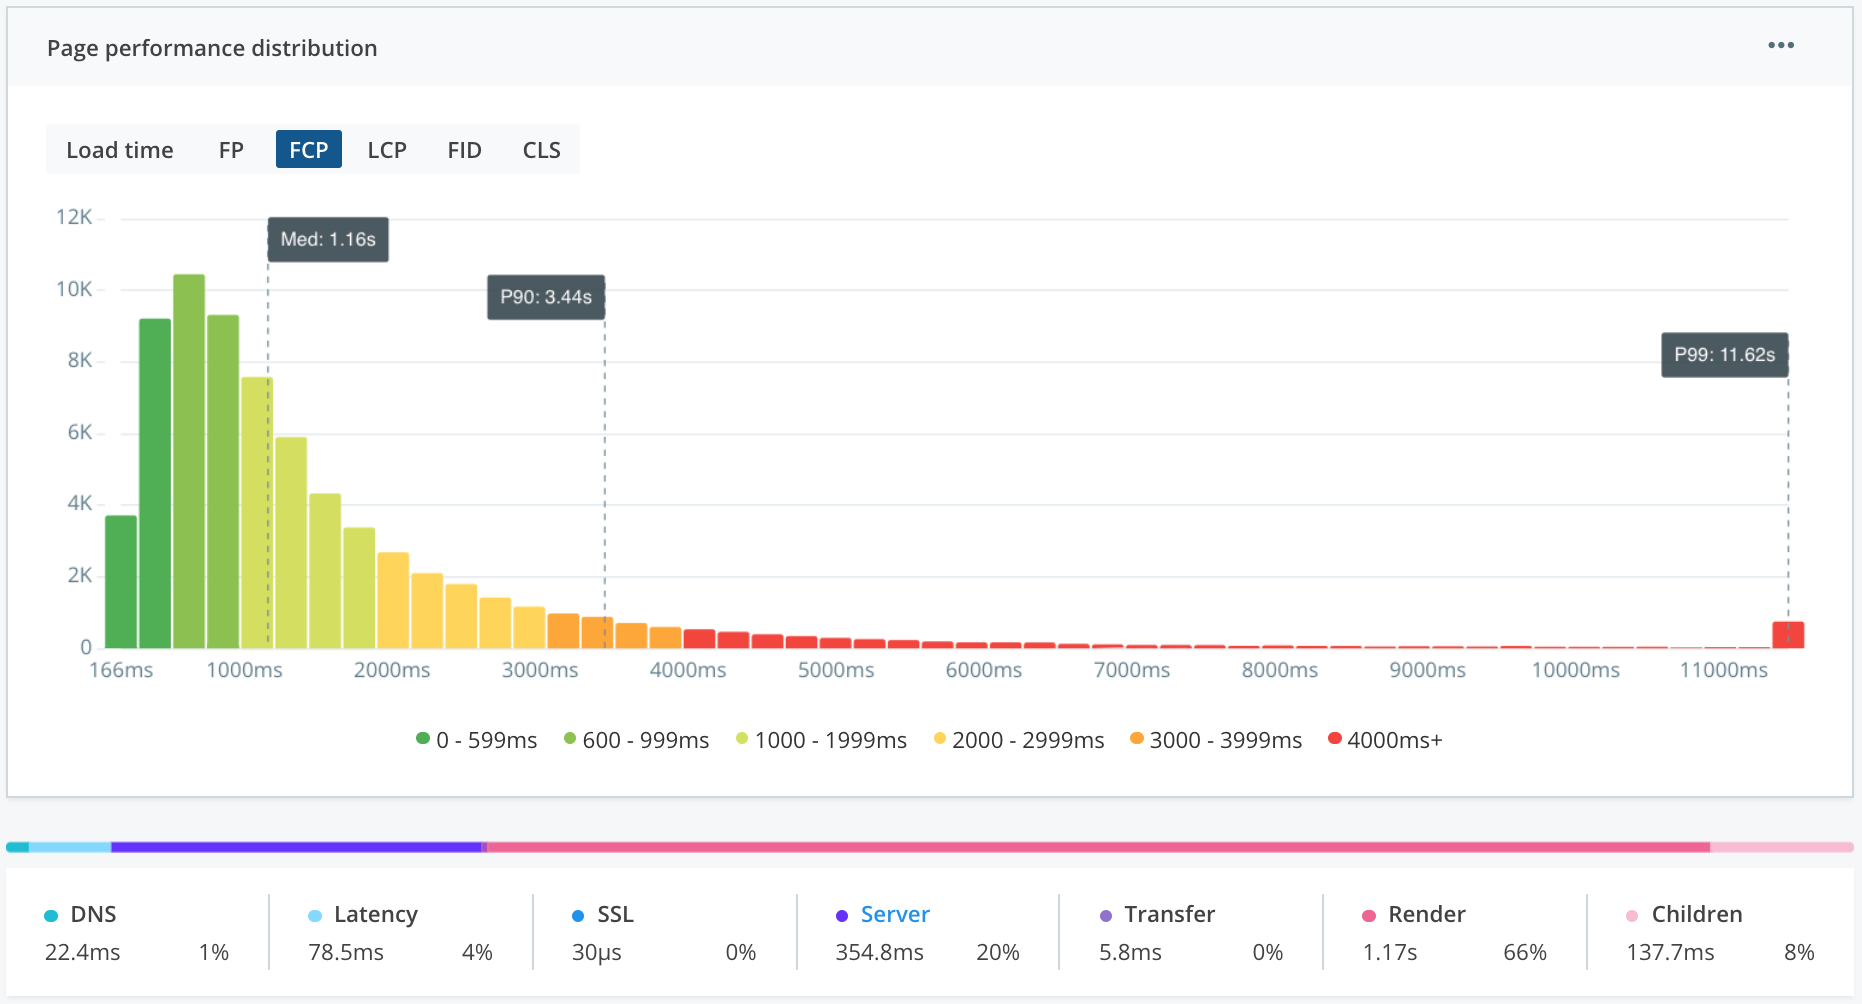
Chrome User Experience Report vs Real User Metrics
There are multiple ways of testing Web Vitals on your application. The easiest one is to open your Chrome Devtools, go to the Lighthouse tab, check your preferences, and generate a report. This is called a Chrome User Experience Report (CrUX), and it is based on a 28-day average of samples from Chrome users who meet certain requirements:
- browsing history sync;
- no Sync passphrase setup;
- usage statistic reporting enabled.
But it’s quite hard to define how representative of your own users the Chrome UX Report is. The report serves as a ballpark range and can offer a good indicator of things to improve on an ad-hoc basis. This is why it’s a very good idea to use a Real User Monitoring (RUM) tool, like Raygun. This will report on people actually interacting with your app, across all browsers, within an allocated timeframe.
Monitoring real user metrics yourself is not a simple task though. There are a plethora of hurdles to be aware of. However, it doesn’t have to be complicated. It’s easy to get set up with getting RUM metrics with performance monitoring tools. One of the options worth considering is Raygun — it can be set up in a few quick steps and is GDPR-friendly. In addition, you also get plenty of error reporting features.
Application Monitoring
Developers often treat observability and performance monitoring as an after-thought. However, monitoring is a crucial aspect of the development lifecycle which helps software teams move faster, prioritize efforts, and avoid serious issues down the road.
Setting up monitoring can be straightforward, and building features that account for observability will help the team do basic maintenance and code hygiene to avoid those dreadful refactoring sprints. Application monitoring can help you sleep peacefully at night and guides your team towards crafting better user experiences.
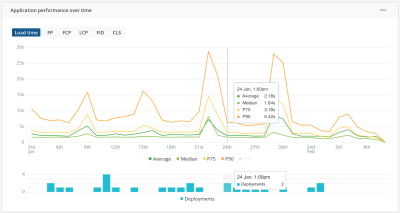
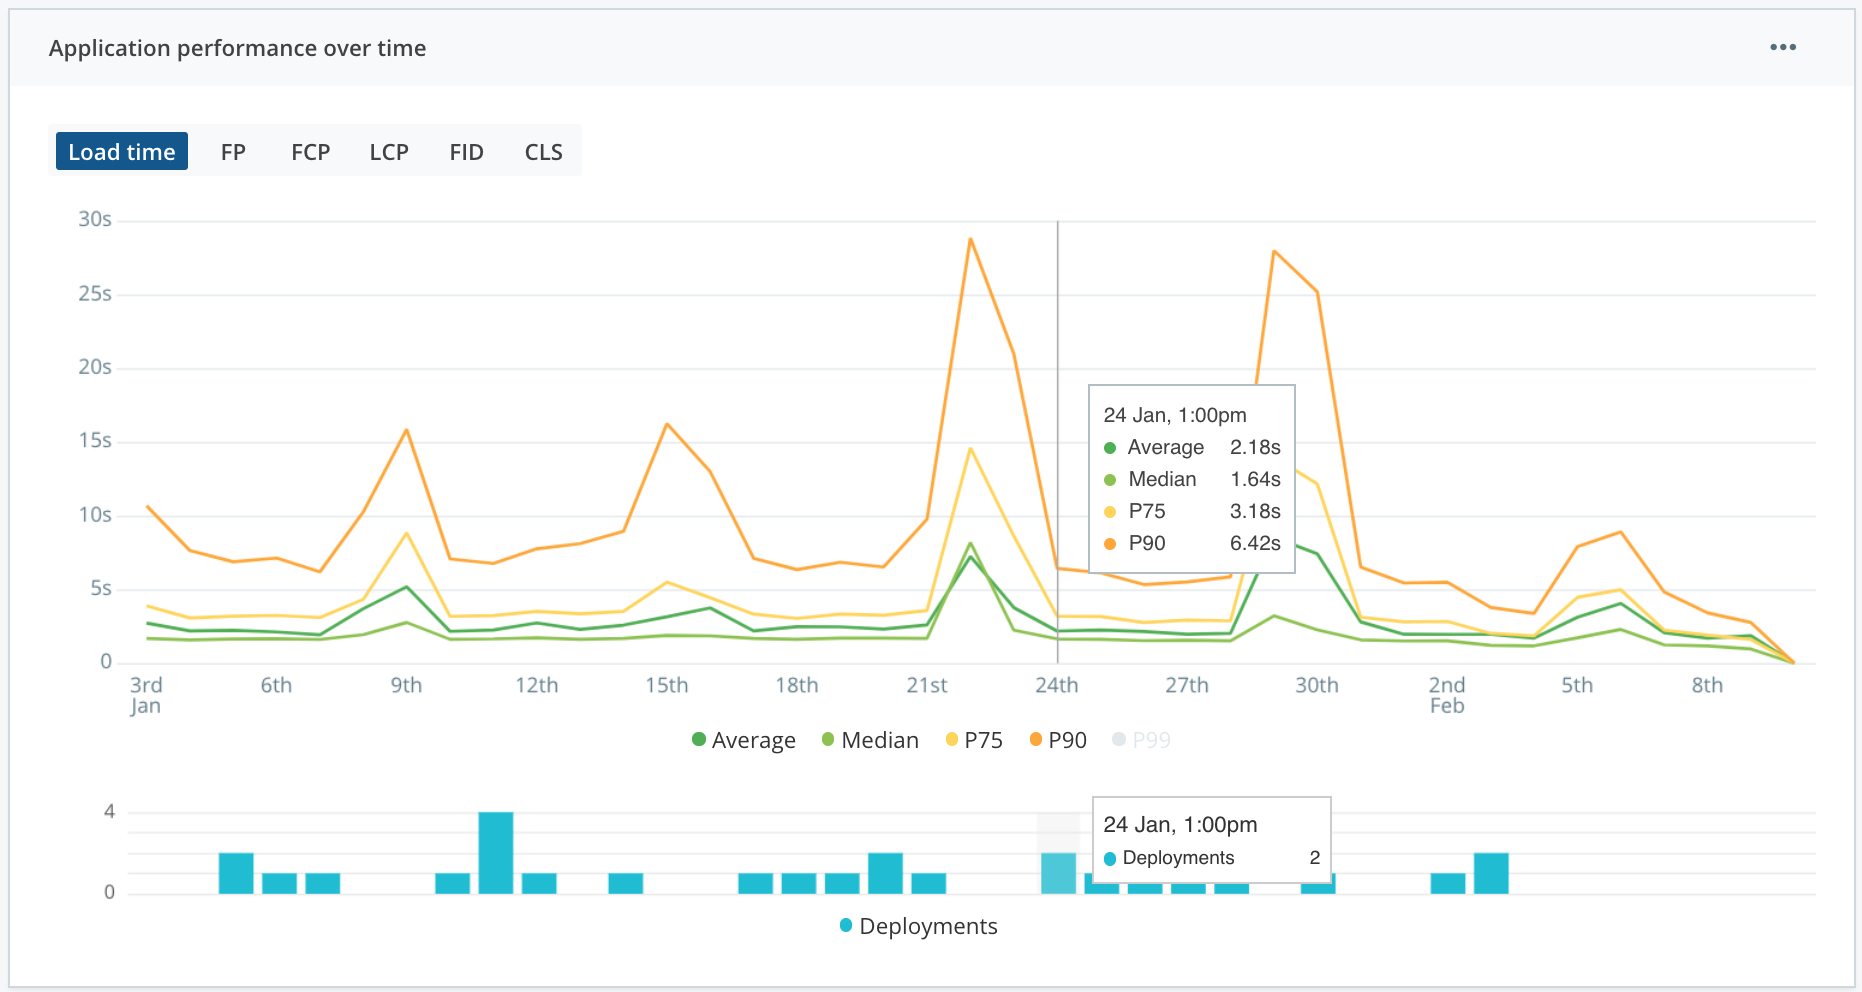
Monitor Trends And Avoid Regressions
In the same way, we have tests running on our Continuous Integration pipeline (ideally) to avoid feature regressions and bugs, we ought to have a way to identify performance regressions for our users immediately after a new deployment. Raygun can help developers automate this work with their Deployment Tracking feature.
Adhering to the performance budget becomes more sustainable. With this information, your team can quickly spot performance regressions (or improvements) across all Web Vitals, identify problematic deployments, and zero in on impacted users.

Drill In And Take Action
When using RUM, it is possible to narrow down results on a per-user basis. For example, in Raygun, it is possible to click on a score or bar on the histogram to see a list of impacted users. This makes it possible to start drilling further into sessions on an individual basis, with instance-level information. This helps taking action directly targeted to the issue instead of simply trusting general best practices. And later on, to diagnose the repercussions of the change.
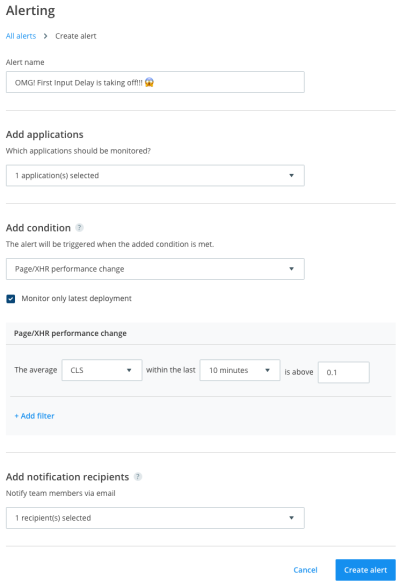
Highlight Unusual Events
Of course, those features are awesome and a responsible developer should keep an eye on application monitoring dashboards. But as your app scales, teams grow, and responsibilities get split, it’s more important than ever to set up automated processes that quickly alert you to any major performance issues. This is why it’s a recommended best practice to set up alert triggers for your application.
Wrapping Up
To summarize, Web Vitals are the new gold standard in performance due to their direct correlation with the user’s experience. Development teams who are actively monitoring and optimizing their Web Vitals based on real user insights will deliver faster and more resilient digital experiences.
We’ve only just scratched the surface of what monitoring can do and solutions to sustain performance maintenance while scaling your app. Let me know in the comments how you employ a Performance Budget, better observability, or other solutions to have a relaxed night of sleep!
Further Reading
- Tight Mode: Why Browsers Produce Different Performance Results
- Performance Signals For Customizing Website UX
- The Importance Of Graceful Degradation In Accessible Interface Design
- T-Shaped vs. V-Shaped Designers