Statoscope: A Course Of Intensive Therapy For Your Bundle

Email Newsletter
Weekly tips on front-end & UX.
Trusted by 182,000+ folks.
 Register for Free
 Custom Web Forms for Angular, React, & Vue. Your backend.

 Celebrating 10 million developers
Editor’s Note: This article is a transcription of Sergey’s live performance (Russian).
In 2016, I released the first version of the Statoscope tool (named “Webpack Runtime Analyzer” at the time). It was a technical demo of another rempl tool made by Roman Dvornov. We wanted to provide a visual interface to analyze bundles in real-time. That is, you run the special tool in your browser, and it shows you what is happening inside your bundle: what it consists of, is it working now, which errors have occurred. At first, utilities for these tasks were available in the console, but not in the browser.
After a year of work on the project, I ran out of ideas and so I put it on pause. But at about the same time, I started working more closely with webpack, contributing to its core. So, in 2018, I wanted to revive Webpack Runtime Analyzer, using my newly accumulated experience.
In October 2020, I released the first version of Statoscope. Basically, it’s the same as Webpack Runtime Analyzer but in a different packaging and with more sophisticated features. It’s simply a more elaborate, in-depth tool for analyzing your bundle.
Content Analysis
This is one of the main features of Statoscope. But first, let’s see how bundling works and what it consist of.
Here is a quite typical configuration with two entry points:
module.exports = {
  entry: {
    main: './main.js',
    admin: './admin.js',
  },
}
This is the main page and admin area. Nothing special, apparently.
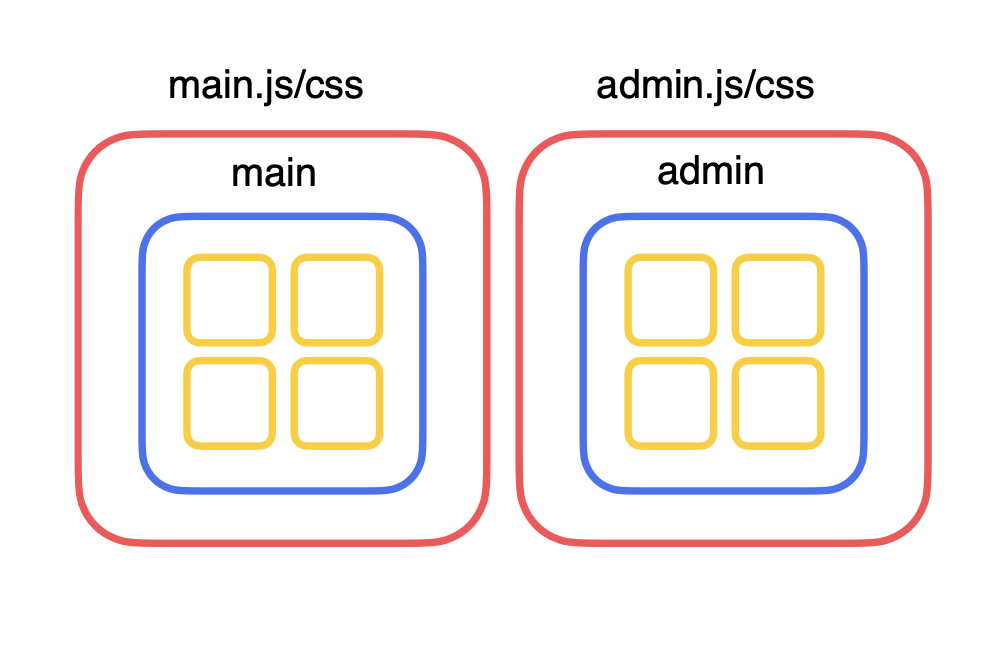
When we run the bundling, webpack defines each JS- or TS-file as a module. The bundle is made up of many JS modules (the yellow squares in the illustration above).
The modules are formed into groups — so-called chunks (the blue squares). There’s a group of modules for the main page, another for the admin area, and so on (the blue squares).
All that is wrapped up in the assets (the red squares). These are the output files, which you see in the dist directory (or build, depending on how yours is set up). This is what webpack operates with.
Let’s check out the stages of the bundling, so we can better understand what’s happening.
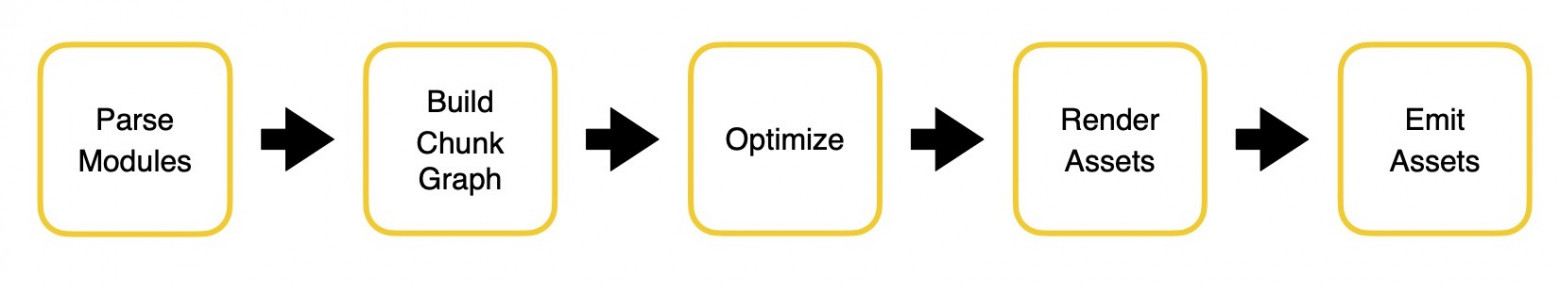
- Wepback takes JS-, TS- or CSS- modules as input and parses them into an abstract ‘syntax tree’.
- Next, Webpack defines links between the modules. For example, Module A imports Module B. And Module B exports something. Basically, a graph of dependencies between the modules is created.
- Then, Webpack optimizes this graph. It might not be completely efficient if we use modules in raw form, as they are in the file system: there might be some doubles, some modules could be combined, and others are only partially used.
Another example: a module has two exports, but we only use one. We don’t need the second export, so we can painlessly remove it without harming the bundled code. This is all part of Webpack’s optimization process, in order to reduce the size of output assets. - Webpack then generates the content of the files that will end up in the
distdirectory. This is the rendering of the assets. - Finally, these files are merged into the directory.
These are the basic stages of how Webpack operates, and what it does with these modules.
What Does Statoscope Work With?
Webpack provides Statoscope with information about all the modules, chunks and assets that it encounters during the build process. They are provided in the form of so-called stats — a big stats.json file, which Webpack generates together with the bundle. This file is transferred to Statoscope (actually, most of the time Statoscope takes it itself). Statoscope reads the file and generates a report in the browser which we can look at, analyze, and so forth.
In brief, here’s the process: Webpack generates stats and sends them to Statoscope, which then generates an HTML report based on them.
How To Receive stats?
There are two ways. First, you can run webpack with --json argument and specify in which file to save the stats. Then you can upload the stats to the sandbox site, which I set up specifically for you to easily drop your stats there and analyze them. This is the easiest way to get a Statoscope report without integrating Statoscope anywhere:
$ webpack –json stats.jsonHowever, I recommend the second way, because it collects much more information about your bundle. You just have to add the Statoscope plugin to your webpack configuration.
config.plugins.push(new StatoscopeWebpackPlugin())That’s it! Just add the Statoscope plugin to your webpack configuration.
What Are stats?
{
  "modules": [/*...*/],
  "chunks": [/*...*/],
  "assets": [/*...*/],
  "entrypoints": {/*...*/},
  /*...*/
}
Stats are the internal information from webpack: which modules, JS-, TS-, and CSS-files it came across, into which chunks these files were combined, and the resulting assets. All this is merged into one large .json file, which Statoscope then analyses.
Details
Let’s look at some module information in more detail:
{
  "identifier": "babel-loader!./src/index.js",
  "name": "./src/index.js",
  "reasons": [/*...*/],
  /*...*/
}
For example: Our main application file, index.js, has an identifier and file name as such; it is located in this path. In the reasons property, we can see where this file is imported to, and where it is used. This is the kind of information that Webpack provides in the stats.
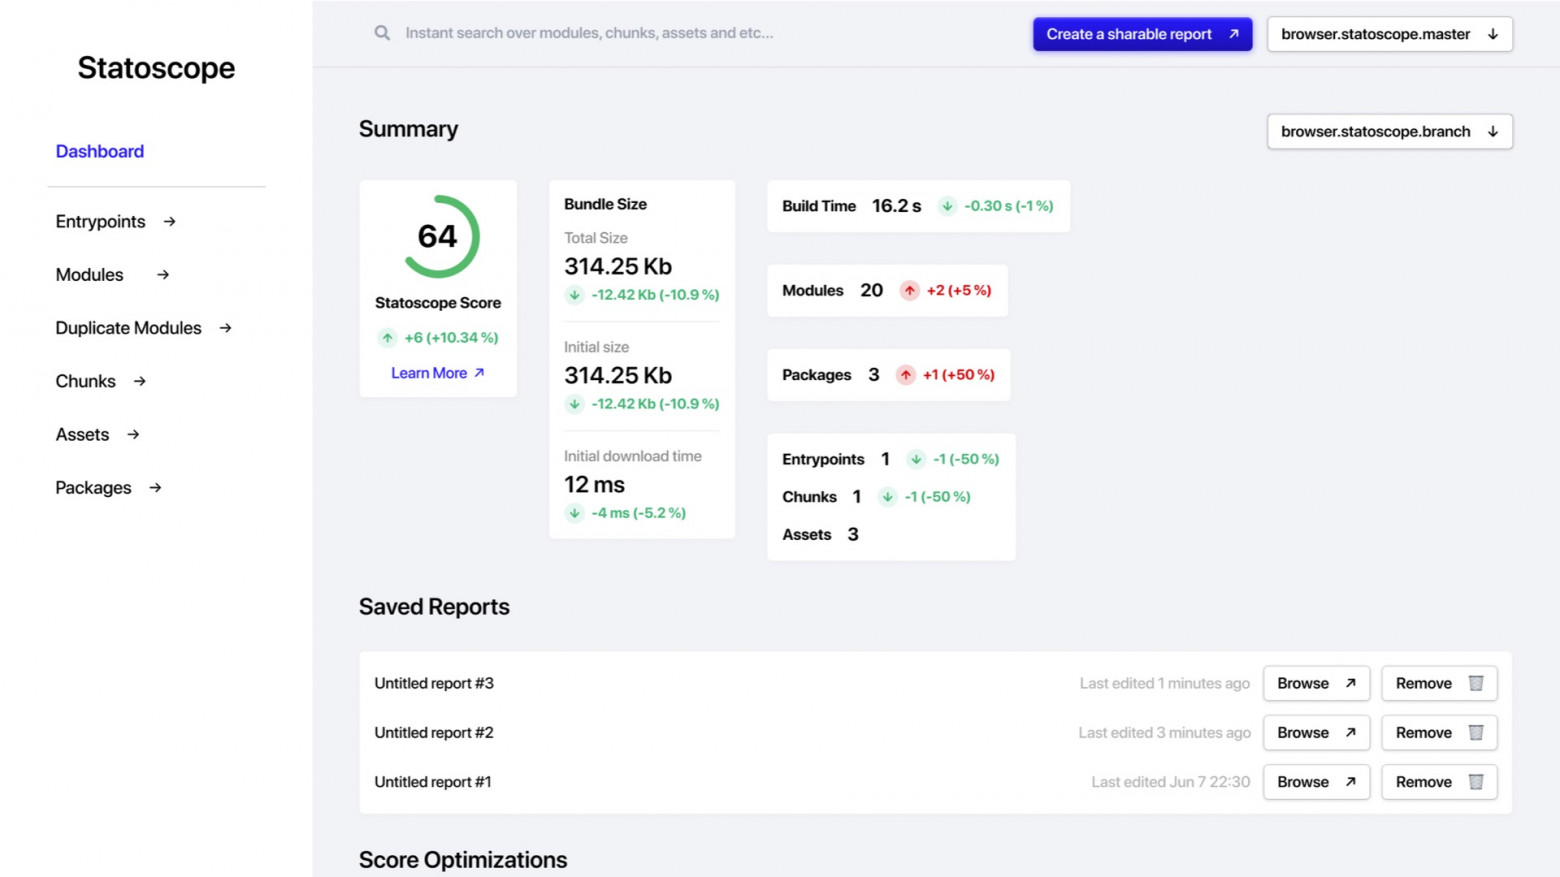
Statoscope processes the stats, performs analysis and provides a visual representation to interpret the results in a convenient form:
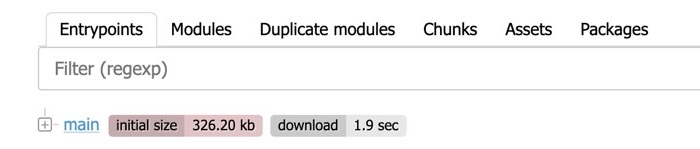
All the things I have mentioned above are here: entrypoints, modules, chunks and assets.
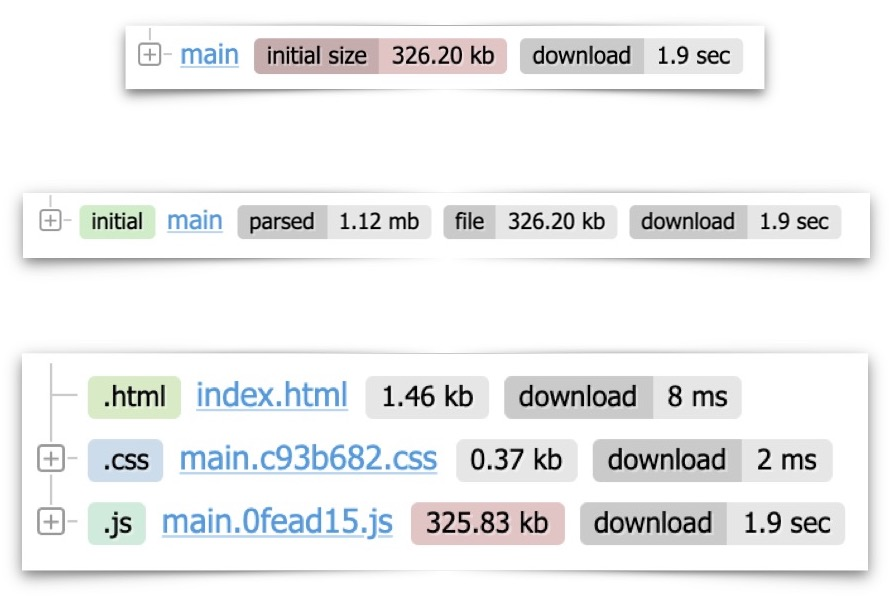
In the middle image above, we can see the chunk main that is async.
There are generally two types of chunk:
initial
This one must load when the page is loaded.async
This one is the result of a dynamic import, and might not load immediately on the page; hence the name,asynchronous. If you split your application into dynamic parts — for example, if you have a large library for animations that only needs to load when the animation is needed — this is anasynchronouschunk.
Copies Of Packages And Their Versions
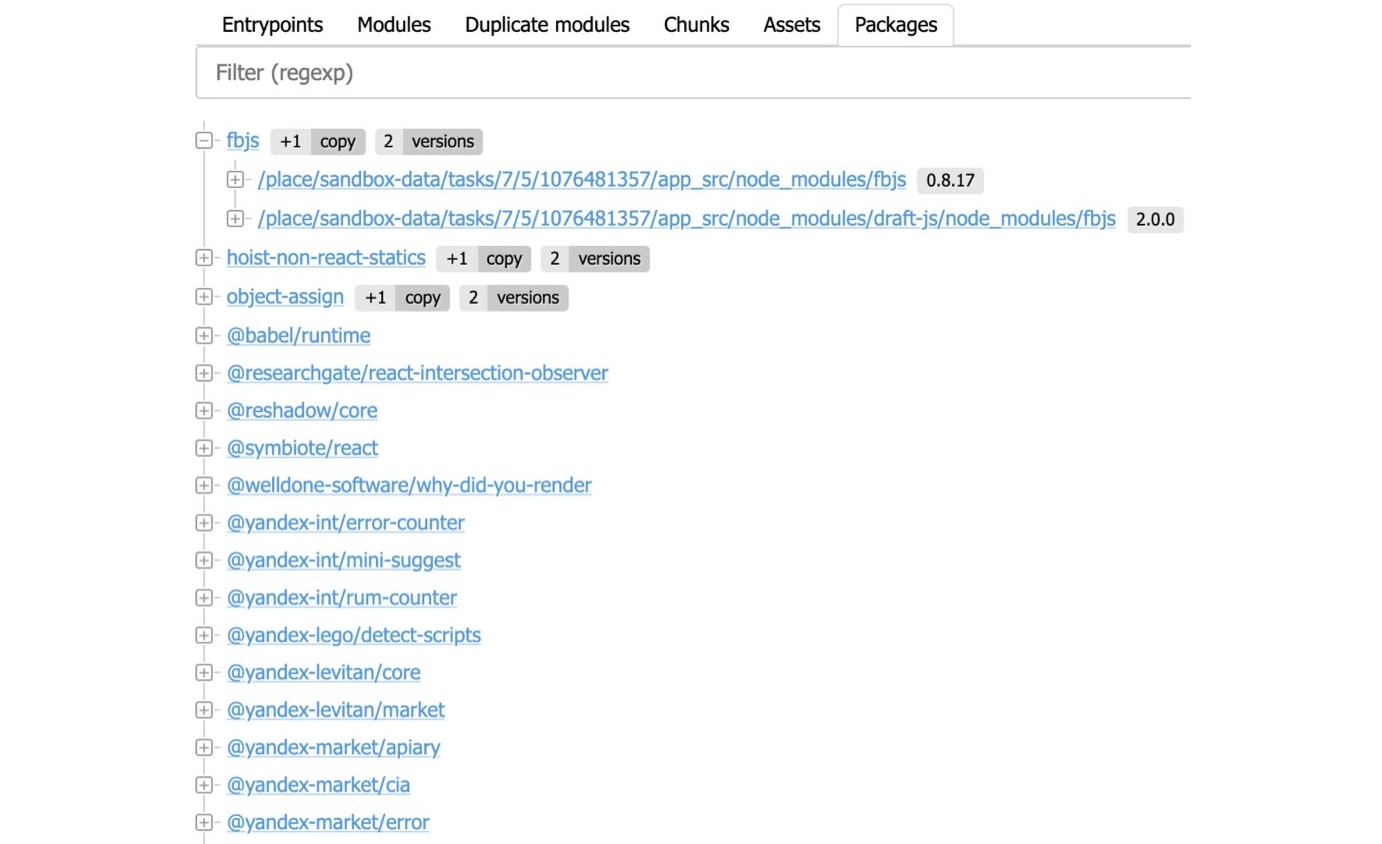
Based on this same information, Statoscope also calculates the package tree — basically the npm-package which is used in your bundle: which packages and how many copies of each.
You might have a situation when you set up, for example, Package A and Package B. These two packages both use the same Package C — but different versions. It turns out that suddenly a double of Package C appears in your bundle. Statoscope tells you: “You have two versions of the package fbjs. At the root, version 0.8.17 is used, while version 2.0.0 is used somewhere in draft-js. Please resolve this. Update your dependencies, and the package duplicate is gone.”
As you can see, Statoscope enriches the stats with some additional information: for example, about package versions. Initially, Webpack stats don’t include information about package versions. Later I will explain how this happens.
Module Map
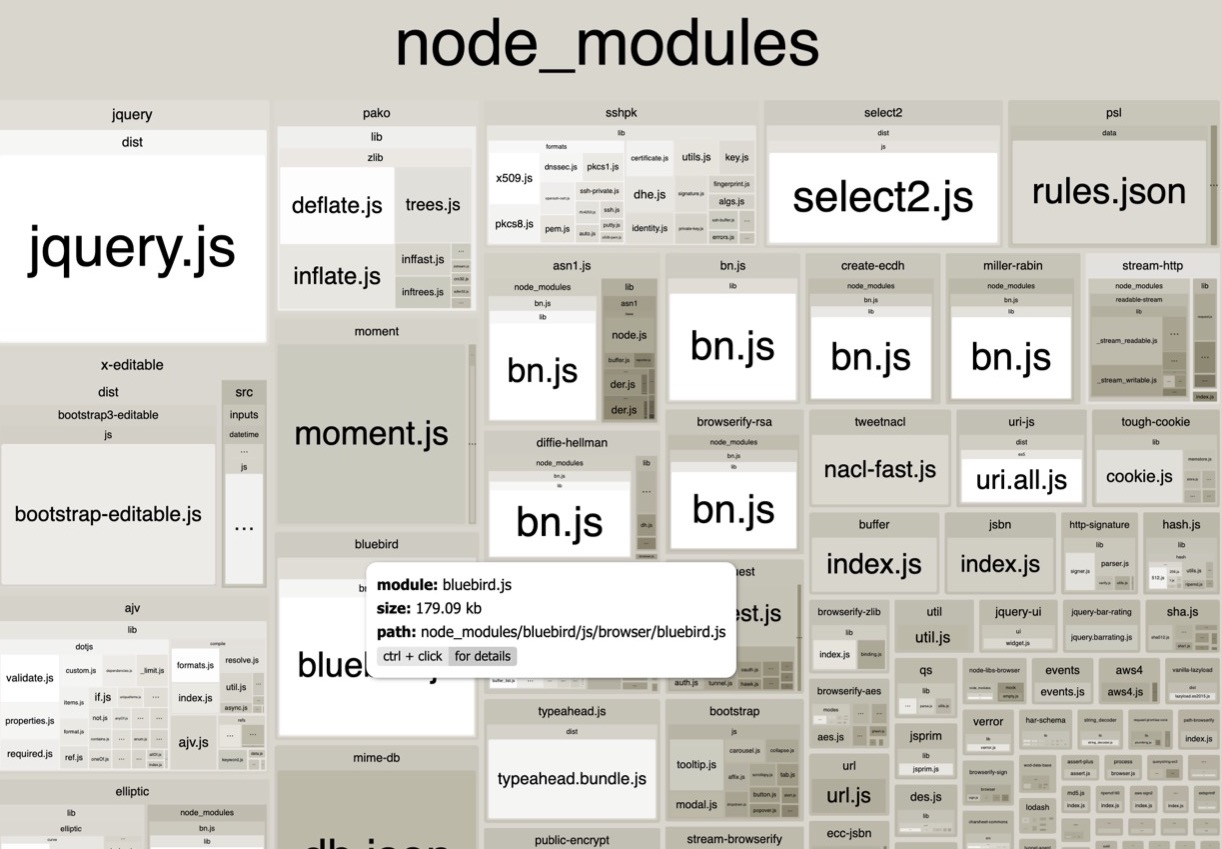
If you’ve already used other tools for analyzing stats, eg. Webpack Bundle Analyzer, then you should be familiar with the module map.
The module map is one part of Statoscope. The difference is that Webpack Bundle Analyzer analyses the internals of Webpack rather than stats. The idea is basically the same, but the approaches are different. Statoscope allows you to analyze modules, module maps, chunks and assets — all in one place.
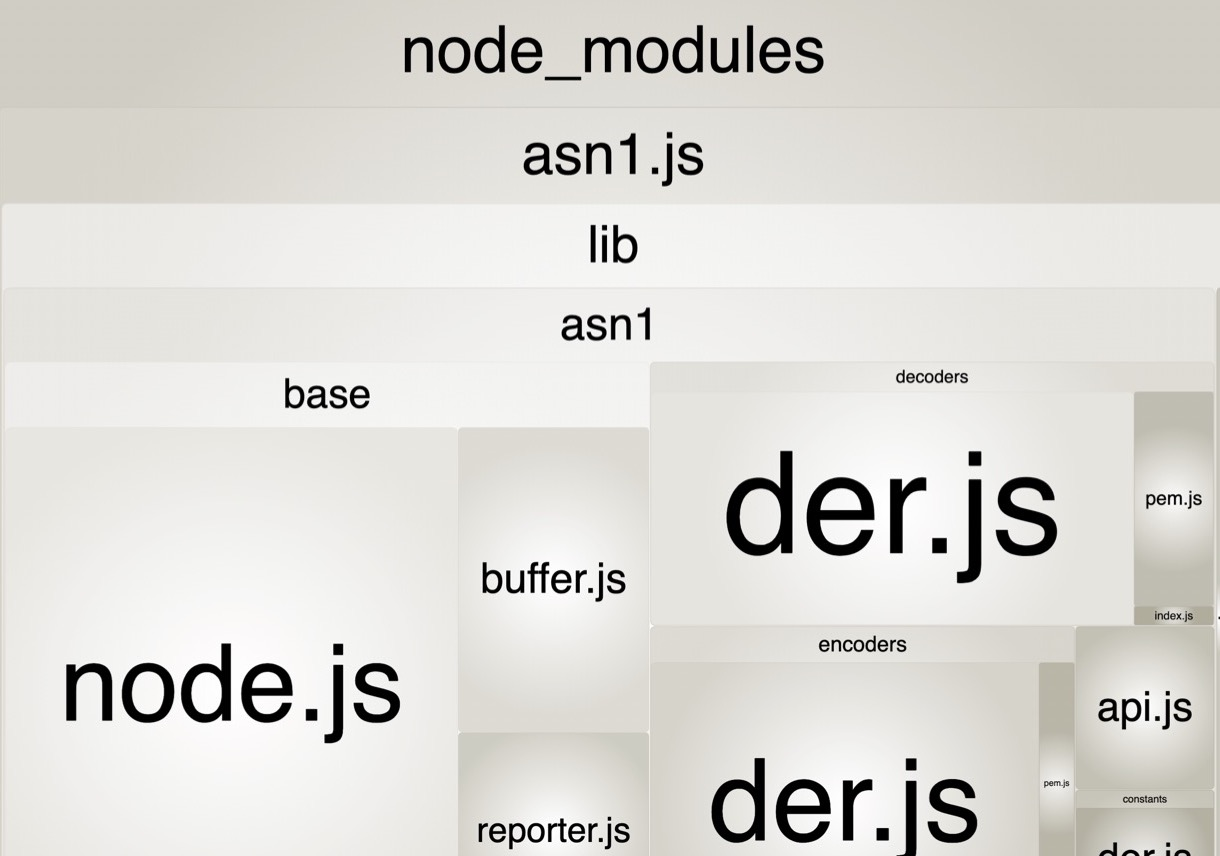
We can open a package page — for example, asn1 — and see what it consists of. Want to know why the package weighs so much? Simply open a specific package page and take a look.
Comparing Bundles
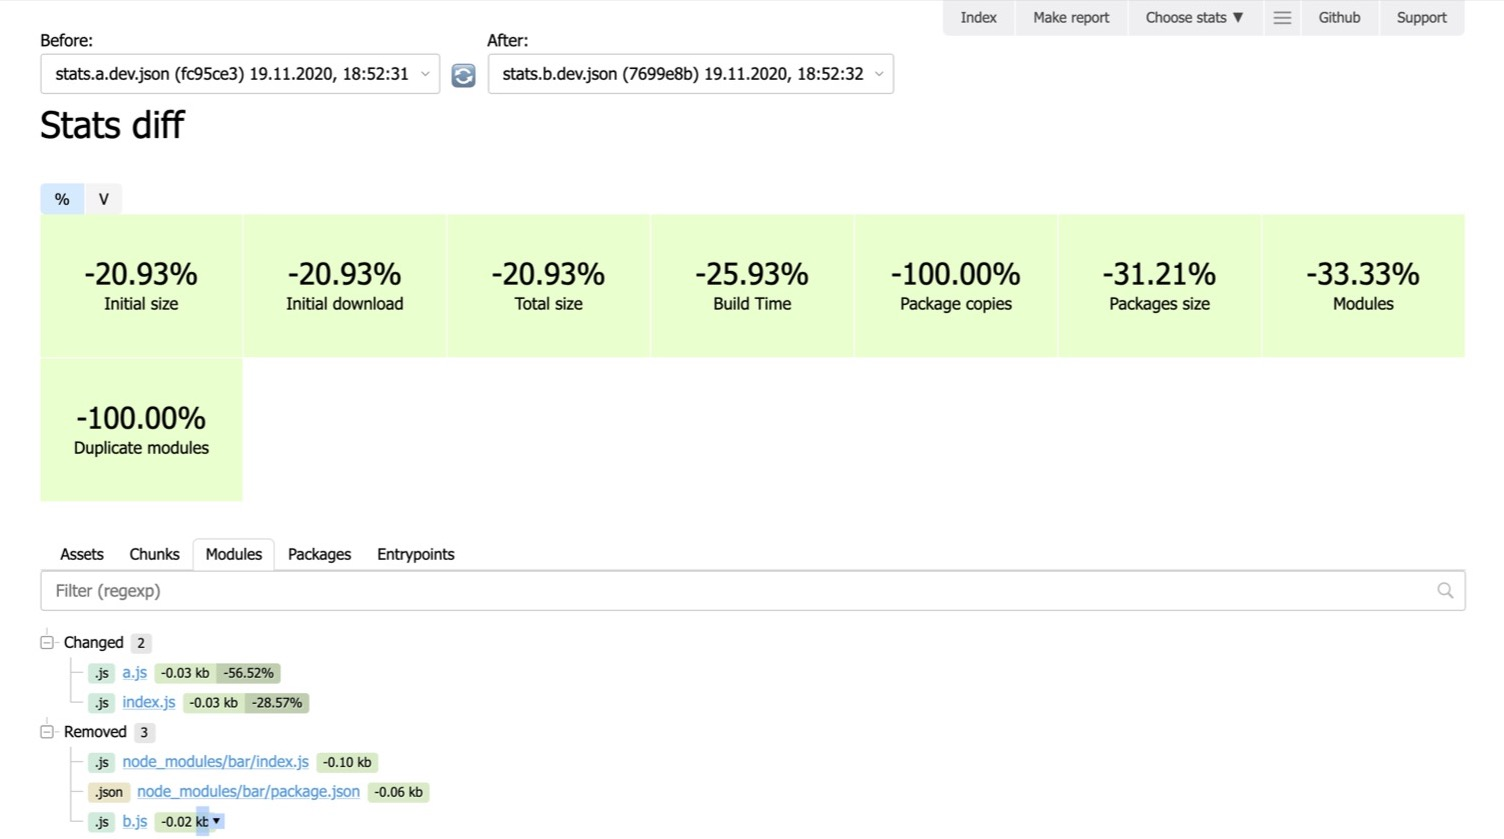
We can select previous and current stats, click the button and Statoscope will show what has changed, generally: which modules were there, which were created, removed, added or simply changed (for example, size change); which chunks were added, changed, removed and so on.
For example, let’s say that the current stats are from your current feature branch. You’re making an awesome feature, and the ‘before’ stats could be stats from the master branch. You want to know: will my new feature weigh down the bundle? Have I made worse what is currently in the master? You can ask these things to Statoscope, and it will tell you if it got worse (or better), and how.
Custom Reports
If Statoscope is not providing you with enough reports, then you can generate your own reports.
But there are a few problems that Statoscope can also solve.
Stats are big .json files, which can become several gigabytes large. This file is its own format, and to extract data it’s often necessary to write a lot of code. Probably, nobody wants to write that code, especially if there’s a lot. If only there were a simpler way…
Jora
One solution to this problem is a query language called jora.
Here’s some JS code that we can use to extract from the stat a list of modules and sort them out by name:
const modules = [];

for (const compilation of compilations) {
  for (const module of compilation.modules) {
    modules.push(module);
  }
}

modules.sort((a, b) => a.name.localeCompare(b.name))
And here’s a little piece of code in Jora, which does the exact same thing.
compilations.modules.sort(=>name)We say: take all the compilations, and take all the modules from them, and sort them by name. That’s it!
As you can see, Jora allows us to reduce the amount of JS-code we write. It’s a light, semantic, understandable language for queries in JSON.
If you have already worked with libraries like jq, then you’ll be familiar with it.
Here are three examples from Jora:
Filter
modules.[size > 1000]We can say: give me all the modules which are bigger than a thousand bytes.
Map
modules.({module: $, size})We want to convert modules into another object. We say: give me modules and add sizes to them. We’ll now have an object with two fields: module and size. Easy and concise.
Map Call
modules.(getModuleSize(hash)).sizeWe make a map, and to get the resulting object we also generate a function that returns the object to us.
UI
So, we’ve worked out how Statoscope lets us make stats queries and create reports using the query language Jora. But how to display it? We need some UI — we can’t just display the structure of the JS object. We want to add the list, title, buttons, and badges.
Seems like we can make the UI in React. But then we run into more problems: the interface has to be bundled and hosted somewhere. Statoscope provides a way to solve this problem.
Discovery.js is a platform for declarative UI.
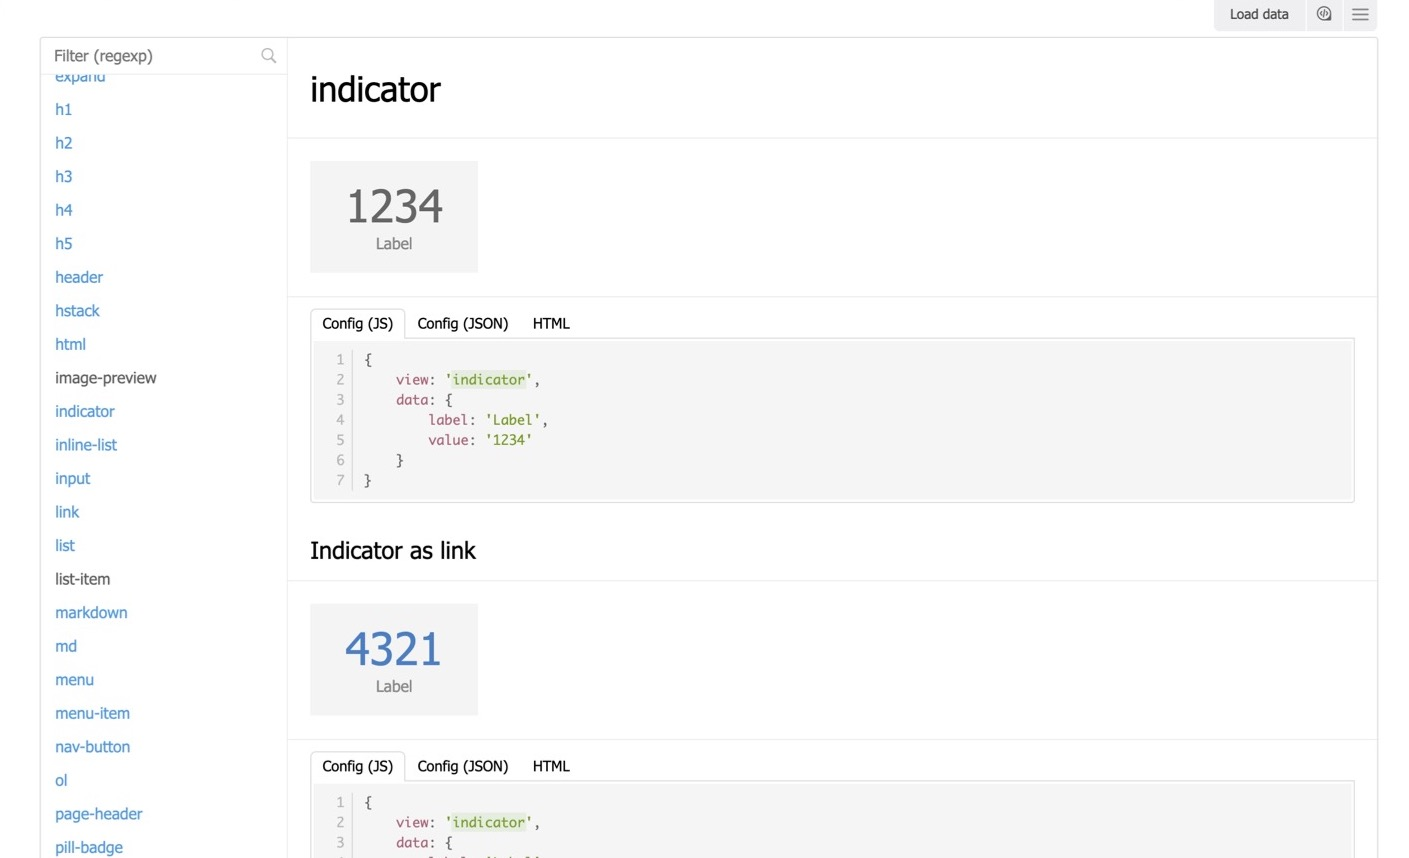
Check this example. On the left, you can see the premade UI elements. Discovery.js contains a ready-made UI kit: buttons, titles, badges, indicators and so on. That’s all ready for you to use.
But the main feature is that you can describe ‘layout’ (views composition) with JSON.
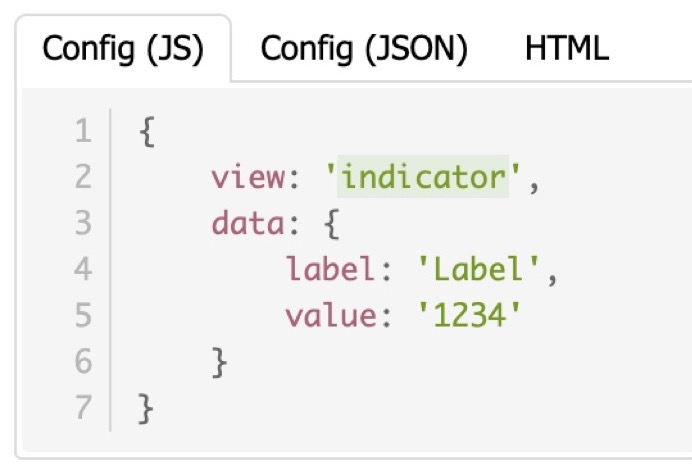
That is, we say: I need an indicator, the label and the value will be as such.
Discovery.js will create an HTML view instead of the JSON. Making a composition from such JSON objects, you can create your own reports.
With the help of jora, you receive data; with ‘layout’ in Discover.js you get a view. Put them together, and you get a report.
Putting It All Together
Here’s how it looks:
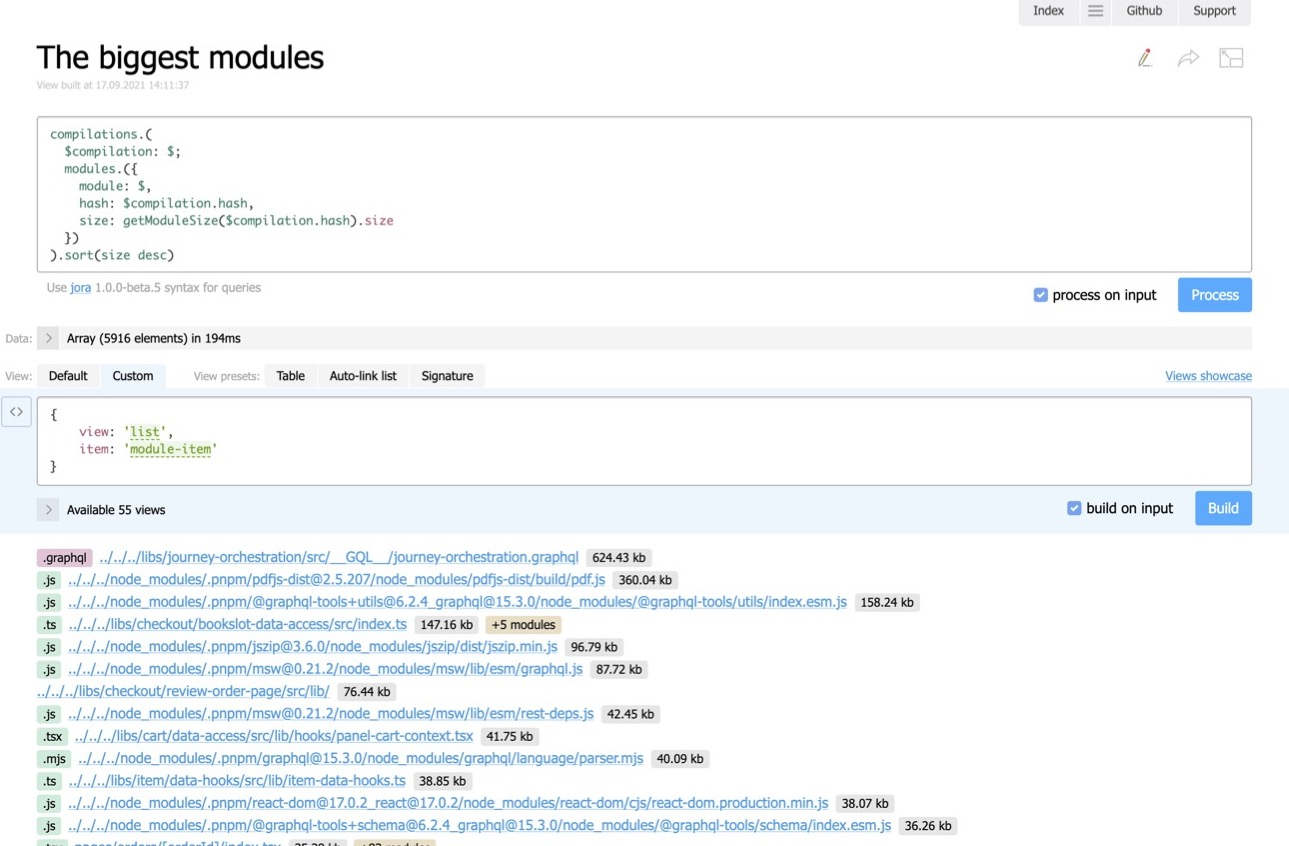
If you click the Make report button in Statoscope, then at the top you can input any query in Jora, in the field below you can input the UI — that is, describe the layout in the JSON form, and below that you get your report.
In this example, we take the modules from all the compilations and sort them by size. We get a super simple report. The heaviest modules will be at the top.
An extra perk is that we can share a link to the report with colleagues. For example, you ran a report in CI, analyzed it, and understood that something wasn’t working right. Simply create the report, copy the link directly in CI, and send it to your colleague. Your colleague will open it and see exactly the same report as you. So simple.
This is one way to generate custom reports on the go. We clicked ‘Make report’, wrote a jora query, used Discovery.js layout, and voila: got a report, good to go.
Integrating Into UI
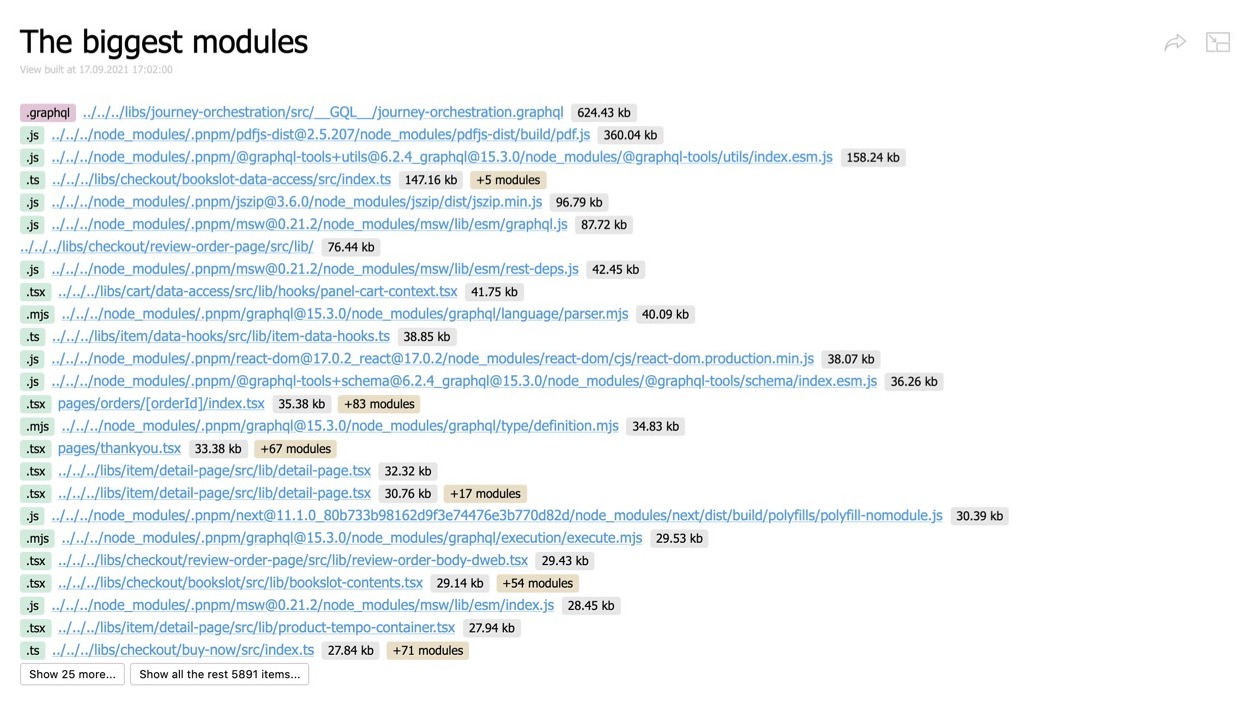
Custom reports like these can also be embedded into your reports in CI, using the Statoscope plugin for Webpack. This plugin has the property reports, which you tell: embed my custom report into my HTML report. This is practically the same as the previous variant, but here we have only the top 20 heaviest modules; we cut off the lower border.
new StatoscopeWebpackPlugin({
  reports: [
    {
      id: 'top-20-biggest-modules',
      name: 'Top 20 biggest modules',
      data: { some: { custom: 'data' } }, // or () => fetchAsyncData()
      view: {
        {
          data: `#.stats.compilations.(
            $compilation: $;
            modules.({
              modules: $,
              hash: $compilation.hash,
              size: getModuleSize($compilation.hash)
            })
          ).sort(size.size desc)[:20]`,
          view: 'list',
          item: 'module-item',
        },
     },
    },
  ],
})
The name of the report is on the 5th line, the data on the 6th — if we need it. We might need it, for example, if we want to create a custom report with metrics about how our bundle has changed. We can import information from our metric storage into data. For example, we can record the daily average bundle build time, send it to storage with the metrics and then embed it into the custom report. We say: take the metrics from there and create a UI report with a line graph showing how our bundle has changed over time. Discovery.js can also create charts like this. So convenient.
The reports you embed into the UI report appear in a dropdown menu like this:
You can share this report with colleagues. Remember the difference: In the first case, you create your report on the go and share it with colleagues; in this case, you embed your report in the HTML, which you get in CI. This won’t be a link with the request, view and so on coded into the GET parameters; this report will be genuinely embedded into the HTML.
Validation
This is a very cool, very important thing. Why is it so important to me? I’ve been getting to grips with it for weeks, trying to work out how to validate stats. I want to set it up so that our pull requests don’t end up in the master in case they worsen the quality of our bundle (e.g. by increasing the bundle size or build time). The master doesn’t need that.
How to make the validation process easy? I had a look around, but I couldn’t find any simple solutions.
I tried different ways to come up with something myself, trying and failing, trying and failing … but finally I worked it out. That’s how Statoscope CLI was born. It’s a console utility that allows you to validate stats.
Install CLI
npm install -D @statoscope/stats-validator-plugin-webpackInstall the plugin for the validation of webpack bundles
npm install -g @statoscope/cliHow does it work? I didn’t want to invent something completely new, so here’s an ESLint which will be familiar to you. It lets you find and fix problems in your JS/TS files. If something goes wrong, like our code doesn’t comply with the rules in the ESLint config, we are notified of the error in the console. If the checks fail in CI, you have to go and fix them.
I wanted to do something similar so that I wouldn’t have to reinvent the wheel. There are already plenty of cool things like Jora and Discovery.js. So, we decided to use the console utility Statoscope CLI as well as the webpack-stats validation plugin (for webpack stats to be validated).
For the moment, Statoscope only works with webpack stats, but ideally, it will be a platform for any bundler. That’s why I made effort to architecturally sculpt each piece of the toolkit (it wasn’t for nothing that said it was a toolkit) so that it functions as a plugin, not as something hardcoded. And I’m getting there, gradually.
So, we install Statoscope CLI and the webpack plugin for validating precisely webpack stats. If you have Rollup, then in the future you’ll have a plugin precisely for its stats, or and likewise for esbuild stats. It’s like in ESLint: if you want to check TypeScript files, you install the corresponding plugin; if you want to check something else, you install a separate plugin and configure the rules.
This is how the Statoscope config for validation looks (actually, not only for validation):
module.exports = {
  validate: {
    // use a plugin with webpack-specific rules
    plugins: ['@statoscope/webpack'},
    reporters: [
      // use console reporter
      '@statoscope/console',
      // use reporter that generated an HTML-report with validation results
      ['@statoscope/stats-report', {open: true}],
    ].
    rules: {
      // a rule that fails validation if build time is worsen at least 10 seconds
      '@statoscope/webpack/build-time-limits': ['error', {global: 10000}],
      // you maight use any other rules
      }
    }
}
Here, everything looks like ESLint — again, no need to reinvent the wheel. We have plugins for validating stats with.
We have reporters to report the result of validation. For now, Statoscope has two built-in reports: a console one (which outputs everything to the console) and stats-report (which generates reports). Generating reports is a killer feature of validation, because searching for and analyzing error messages in large numbers is difficult.
Next, I want to connect these error messages to specific modules. I want to open a module and see which messages are related to it. Doing this in the console is impossible: the text format is not interactive, and I don’t want to do any really complicated UI stuff.
In the rules property, we say which rules we want to apply to the validation. There are about 12 rules now. For example, there are rules for budgeting the bundle size, the initial bundle size, and the bundle loading size on the client-side.
For example, you don’t want pull requests — which increases the download time of your bundle on slow 3G — to end up in the master. So, you set the rule, which Statoscope already has.
You can go to Statoscope’s repository and find documentation on every rule. There are rules for many diverse situations, for example “do not permit using package copies”. If you happen to make a pull request that adds a double, this request will not be accepted, and you will be sent back to do it again (this kind of thing happens in CI).
Running Validation
It’s all pretty simple. We run this in the console:
$ statoscope validate --input ./stats.jsonWe input the command statoscope validate, which lets us validate, and we indicate on which stats-file we want to run a test. We receive a report (in the console and the browser).
Here we have validated one stats file. But in addition to a rule that analyzes a single stats file (like “are there doubles?”), can we make a rule that compares, for example, how much you have increased the bundle size? For example, you want to increase no more than 2%. For that, you need to use stats from both the current branch and the master.
So, a little terminology:
input
A currentstatsfile (from your branch).reference
The previousstatsfile with which the reference is made (from master).
Receiving A Report
Let’s look at what we saw in the console, but in a digestible format:
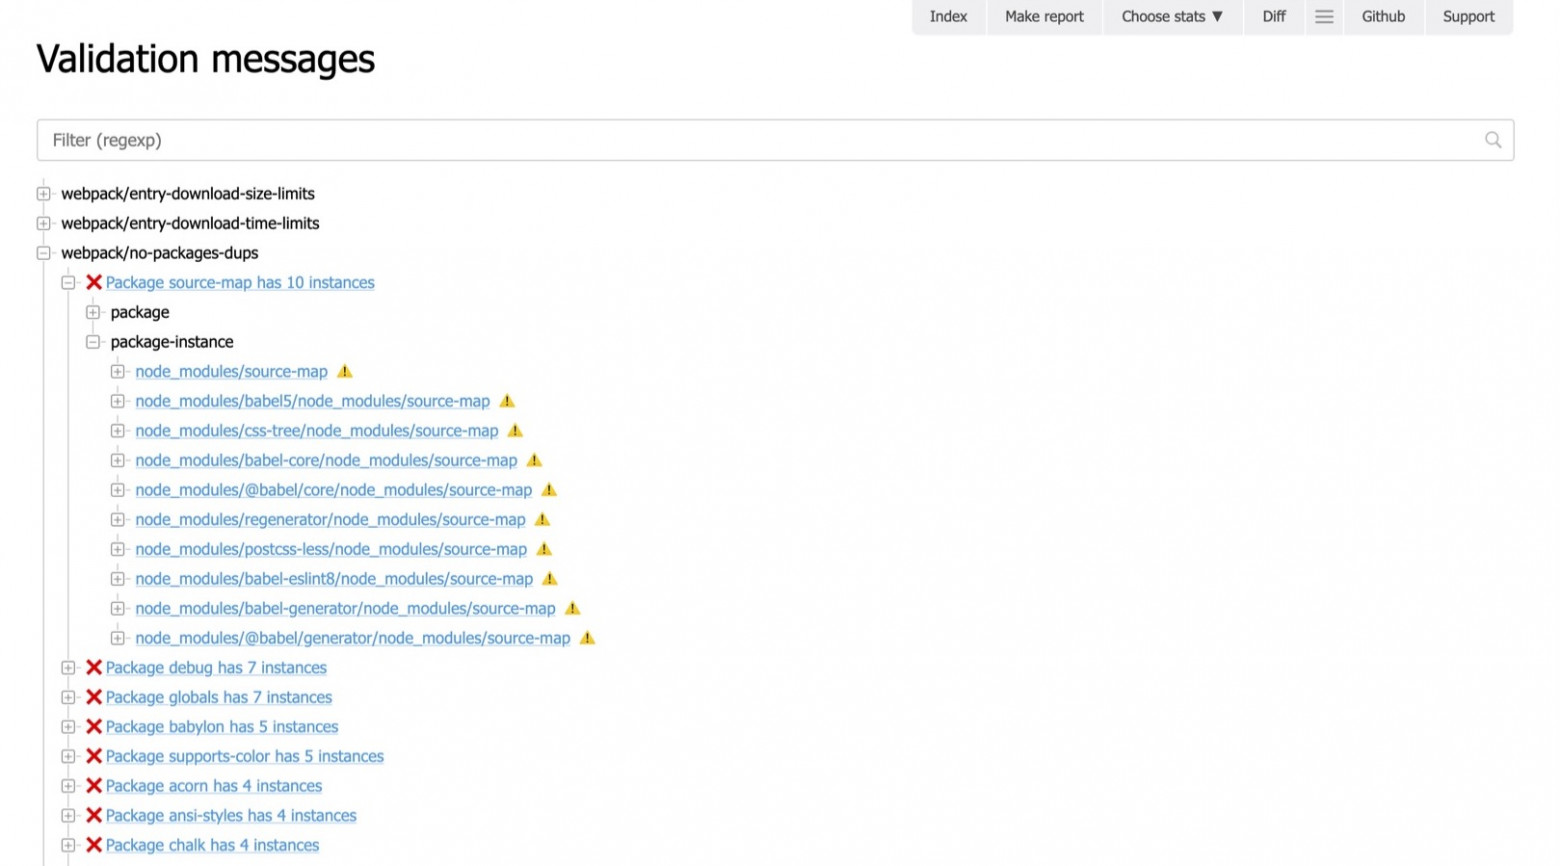
This is a tree where everything is highlighted, elements can be hidden or revealed, they can be links (you can check the error message, or with which error it’s related). Here you can even filter using the field above. This is much more convenient than using grep-like tools and analyzing the console output.
Stats Queries
Moving on to the next part regarding CLI. Why might we need stats queries?
Here’s your stats.json: information about modules, chunks and assets. We want to get from the stats the size or length of your bundle. You might need this, for example, for creating custom comments for your pull request or for sending metrics.
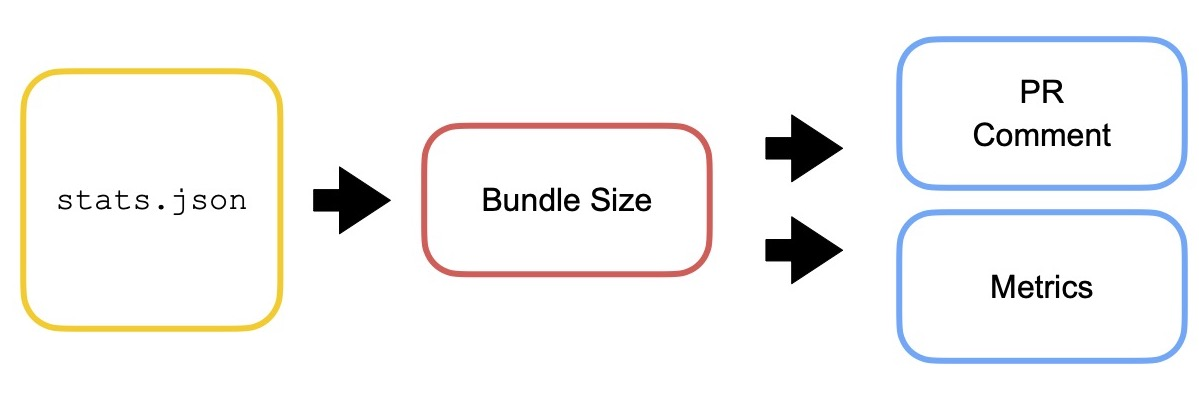
If you have access only to the visual part, it becomes a problem: it’s not clear how to extract the data from there. But you have the console utility statoscope query, with which we can work it all out. It lets us make a Jora query.
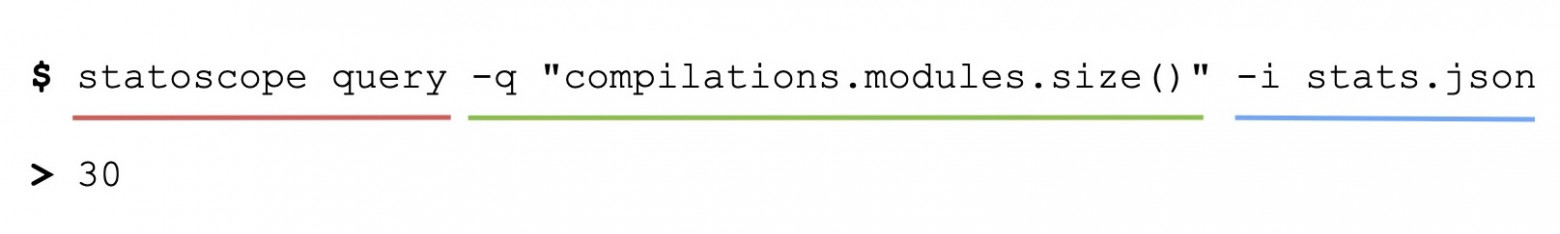
Under the green line: which query we want to make; under the blue: which stats we want to query. For example, we say: give us the number of modules. And the utility responds.
We can make any Jora query and save it in a separate file. So, we can say: give me the query from query.jora file, send it to the statoscope query, apply it to these stats, and then save the result in the result.json file.

For example, we want to attach the number of validation errors to the commentary of the pull request — please!
CI — Putting It All Together
Let’s see what happens if we bring together validation and statoscope query. I’ll show this based on Github Actions.
Commits In Master
As I have already said, we have input-stats (in the current branch) and reference-stats (from the master). How do we obtain and store them? For every commit in the master, we make a bundle (if we committed something to the master, it means that everything is fine). We get the stats from it, call the file reference.json and send it to our storage of artifacts — which could be anything.
If we’re talking about GitHub, there’s already built-in artifact storage. We don’t need to do anything special, just say upload artifact. From then on, you have stats from the master and they are saved somewhere.
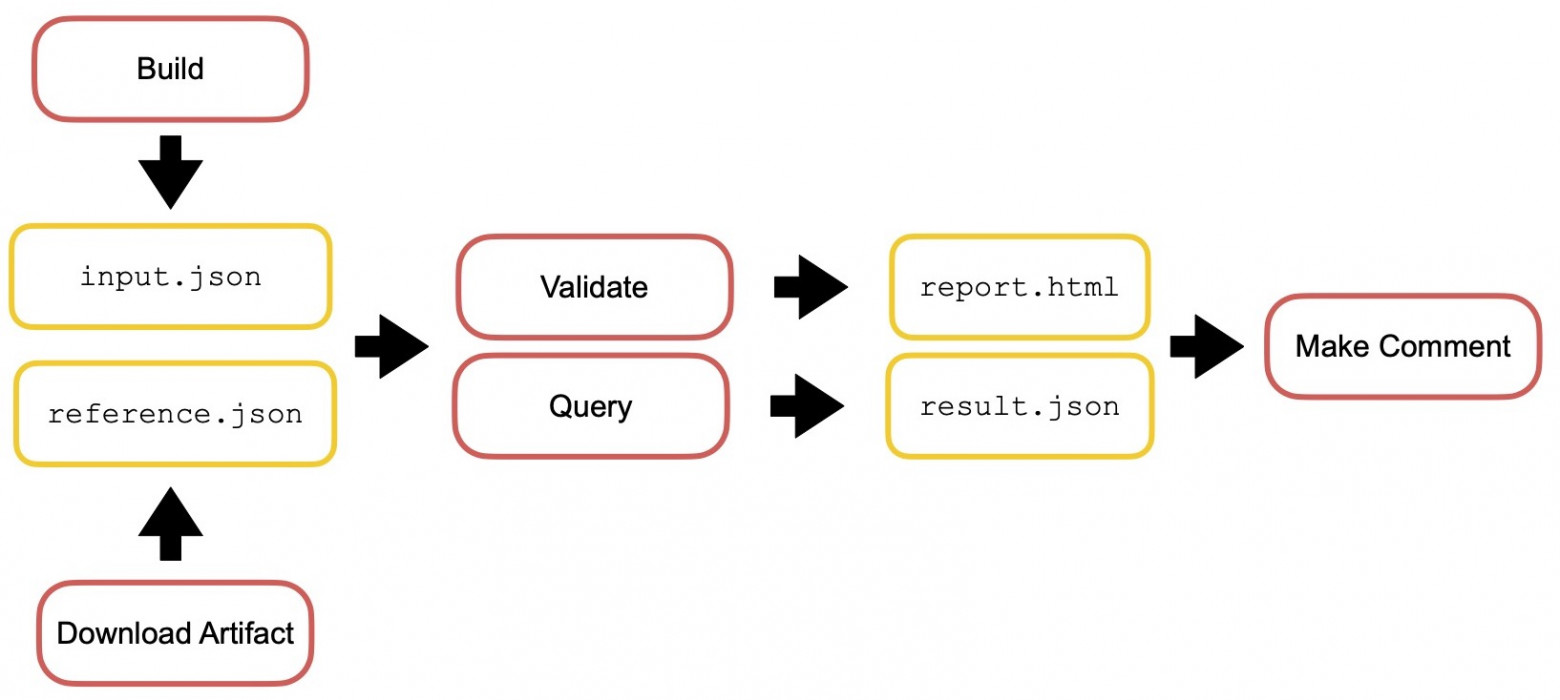
Commits In Pull Requests
But most interestingly: we also have comments in pull requests. For each commit in a pull request, we build the bundle, get the webpack stats from it, call that file input.json, download the artifact reference.json from the previous step, and you now have two files. We give these two stats to statoscope validate (we get a report.html) and statoscope query (we get a result.json).
That’s it! We have a UI report and custom data from the query, and we can now create (for example) some custom commentary on behalf of our bot.
How can we do this? Let’s see. The commentary text will be some data from the query, plus some kind of template. I’ll give a Jora query as an example — it’s not as long as it might seem:
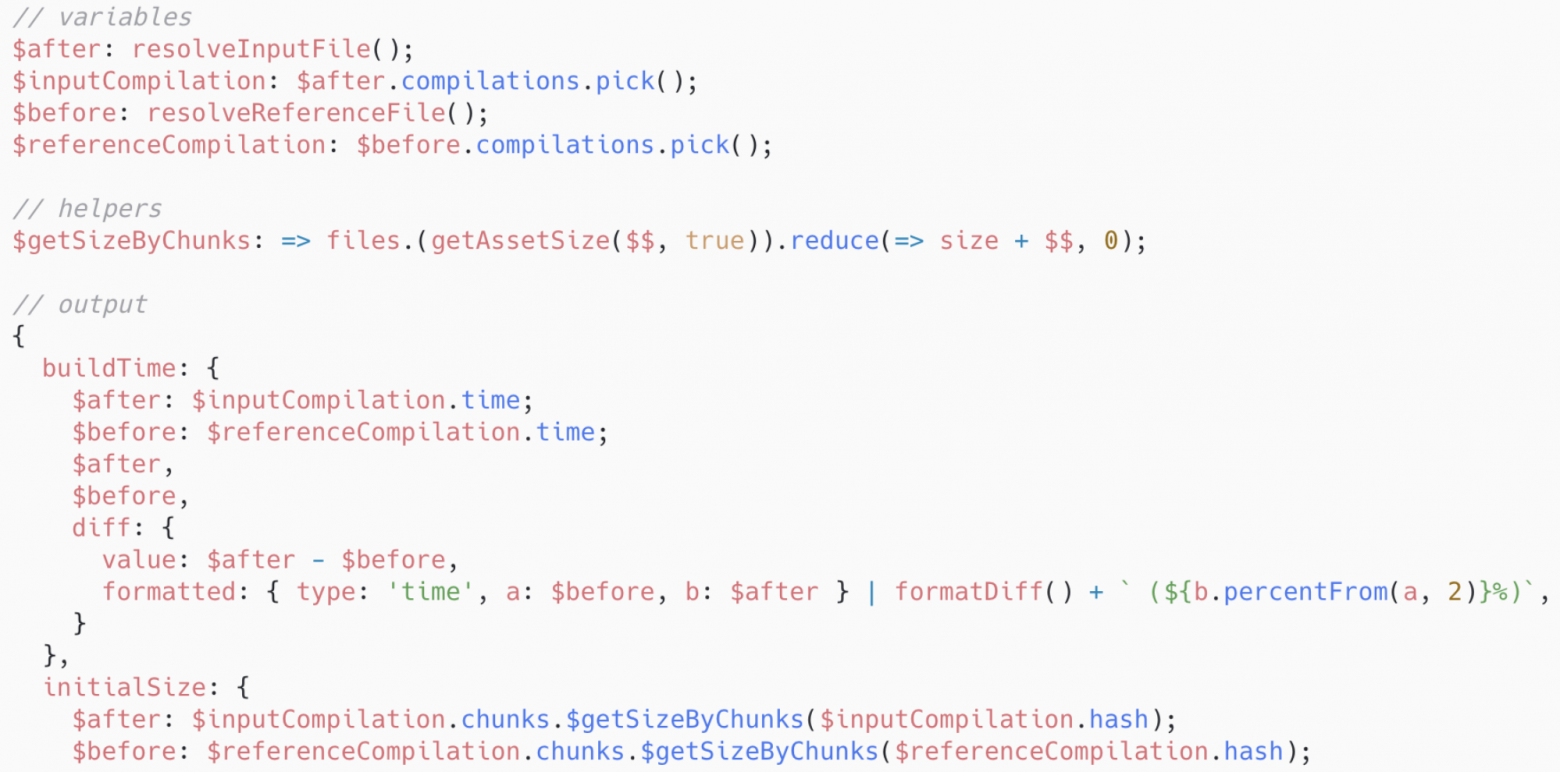
It gets the build time from two stats (reference and input), subtracts one from the other and gets the difference — for better or worse. The same thing happens with initial size: how much our bundle has gotten bigger or smaller. It also looks at the number of validation mistakes and dumps it in JSON.
Here’s our commentary template:
Note: I chose the template engine moustache, but it could be any other.
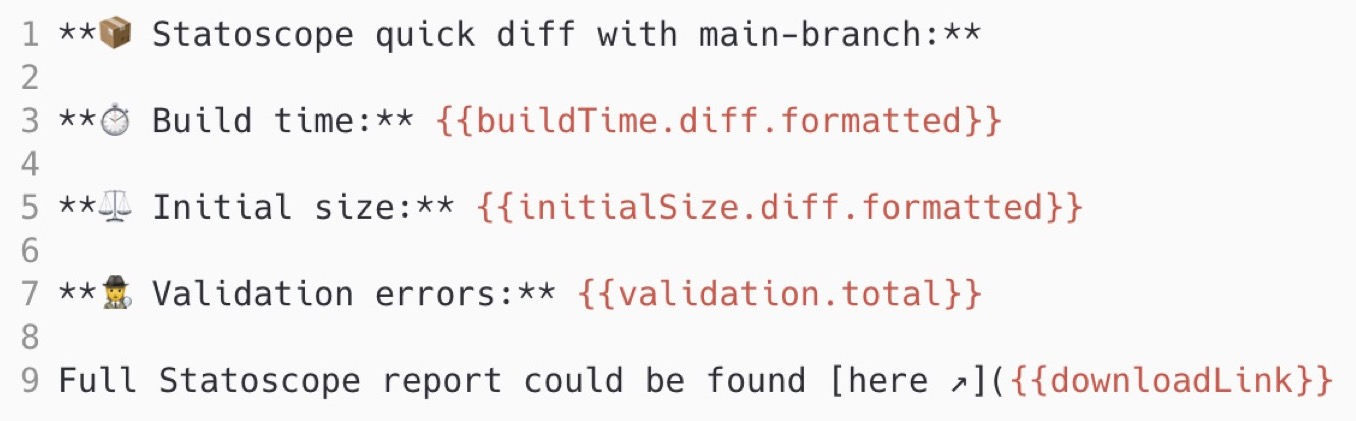
We say: the build time changed like this, the initial size like this, the number of validation errors are like this. And a link to the full report.
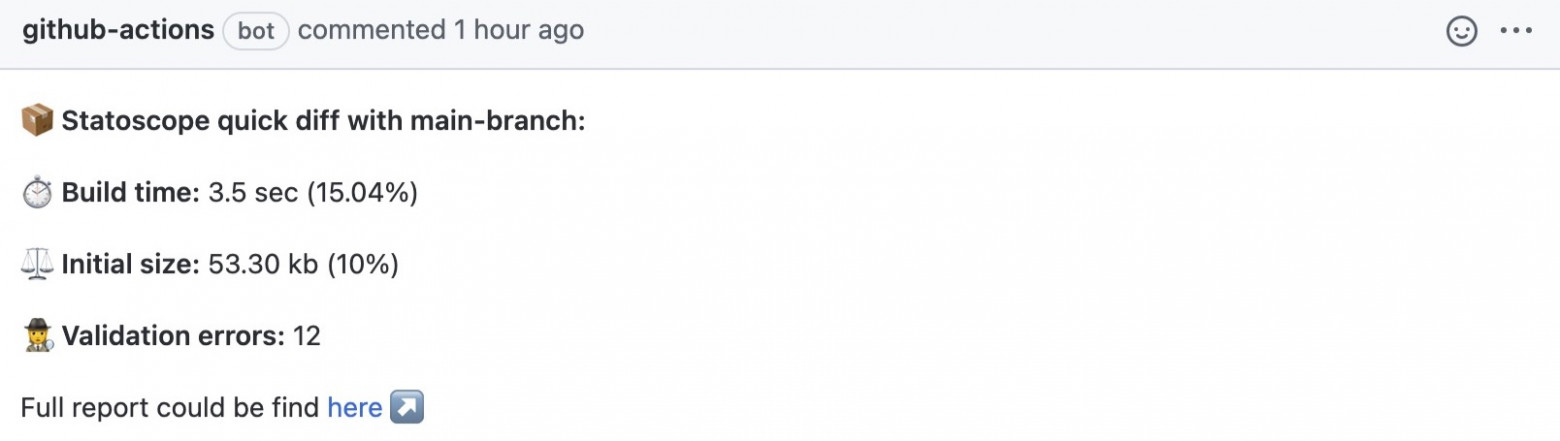
So, here’s what we end up with: we attach a commentary to pull requests on behalf of our bot.
We do all this as part of our process, our CI. We have a range of checks like checking our code, and in a separate step we have the Statoscope check: validations, downloading artifacts, our own queries and creating commentaries. These are separate steps. In this case, we have a red cross next to the Statoscope check which means something went wrong in validation.
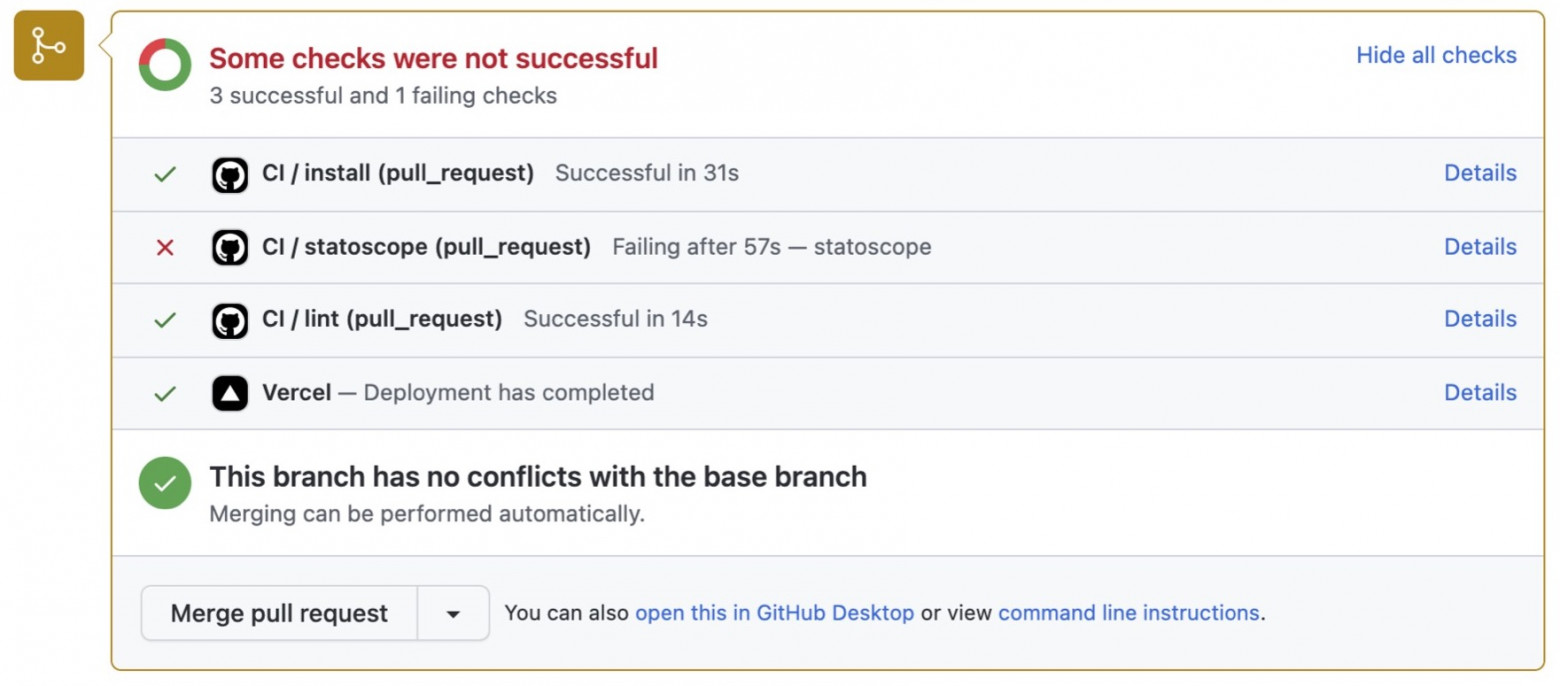
You want to know what? Simply go to the UI report from the commentary and enjoy.
The full source code Github Action, which does everything I have shown (with templates and Jora queries) you can see in the statoscope.tech repository. This is not some ephemeral thing that I just showed; everything already works, for every pull request in that repository a report will be generated. You can input a test pull request and see what happens. (The source code of every Github Actions can be found within the workflows file, so you can see how it all works.)
Plans
Coming to the end of this article, I’ll tell you about our upcoming plans because they’re huge.
- Custom
statsformat.
Remember that I’m taking Statoscope towards independence from any specific bundler. But in order not to block it off from differentstatsformats, I want to transform them all into one universal format. - I really want to let you extend the UI.
Generally, extensibility is a key particularity of the project, which I’m working towards. I want Statoscope to be extended with plugins. - The above-mentioned support from other bundlers.
I want to decouple Statoscope from webpack, so that no mention of webpack is made in Statoscope — only in the plugins. - Simpler process.
I want to combine the integration process in CI into a single Github Action and publish it as a package, so that you don’t copy and paste the source code but rather install Github Action and use it. - A single portal for documentation.
At the moment all documentation is shoved into readme files in the repository. If you go to the repository, you’ll see the packages folder, and there’s basically some documentation for some packages. I would really like a single portal for documentation — something like how Jest have done it (I love the way they’ve done it). - I want to support
rempl(a technology which appeared in demo form as Webpack Bundle Analyzer in 2016).
The idea is that if you use a bundle in a watch-mode like HMR (Hot Module Replacement), you open your browser and you’ll have access to Statoscope directly in the developer tools in the browser. You change something in the source code (like properties of some React component), you save it, HMR works it out for you, Statoscope is in the develop tools of your browser as well, and you don’t need to generate reports constantly. - Analysis of the bundler config.
Configuration, in particular webpack, is of course a separate story and a separate skill. And I really want to provide colleagues with some advice and modify the config in real time, so that it is effective. When Statoscope has functionality like this, it will be easier to make effective bundles. - Recommendation on the optimization of bundles.
I would like Statoscope to be able to say: “Listen colleague, you’ve got this thing wrong, you can optimise something here — make these changes, and you’ll reduce the size of your bundle by this many megabytes.” - Redesign.
I want to give special thanks to my colleague Danila Avdoshin, who found the free time to work on the redesign. For now it’s only saved in Figma prototypes, but I’m sure that we’ll get round to finishing it soon. - And my personal dream: bundle rating.
I want to be able to compare the quality of bundles. For now, I’m just thinking about how to do this, but I would like to see the top bundles in terms of configuration efficiency, the efficiency of using webpack possibilities, and so on.
Why am I telling you about my plans? Statoscope is a fully open-source project, so I welcome issues and pull requests. I quickly respond to issues. If you want to participate in a serious project, you can help with any of the points above.
Here’s how Danila designed how it could look:
The point here is the flexible UI: you can customize which blocks you need on the page, and decide generally what you want to show. For example, I don’t need a list of modules, but instead I can show a chart in that space.
Danila designed this prototype, it’s in Figma, you can also contribute here. I’ll get there eventually, but meanwhile, you can help.
Call To Action
Finally, what I’m asking for in this article:
- Try
statoscope.tech. It’s a sandbox, there’s demo data, and you can load your own. - Try
@statoscope/webpack-plugin. Remember, this plugin collects much more information than webpack itself provides. - Try
@statoscope/clifor validation, queries and creating commentaries. By the way, Statoscope is currently used in Andrei Sitnik’ssize-limitpackage. Not long ago we integrated it there together, replacing Webpack Bundle Analyzer. Now when you runsize-limitwith the--why(“Why did the size increase”), Statoscope will open. - Share feedback, ask questions.
- Get familiar with Jora. It’s a simple, concise language without too many constructions. And you’ll be able to write reports at least, and then rules.
- Take a look at
Discovery.js. - Write your report.
- Write your validation rule.
- Write your permission.
- Bring your PR/Issue.
- Put a star on GitHub. I’d like that. :)
Further Reading
- Transitioning Top-Layer Entries And The Display Property In CSS
- Tree-Shaking: A Reference Guide
- On-Device AI: Building Smarter, Faster, And Private Applications
- How To Design For High-Traffic Events And Prevent Your Website From Crashing


