How To Use Google CrUX To Analyze And Compare The Performance Of JS Frameworks

Email Newsletter
Weekly tips on front-end & UX.
Trusted by 182,000+ folks.


 Custom Web Forms for Angular, React, & Vue. Your backend.
 Celebrating 10 million developers
In recent years, frameworks have taken over web development, and React is leading the charge. These days it is fairly uncommon to encounter a new website or web app that doesn’t rely on some framework, or a platform such as a CMS.
And while React’s tagline is “a JavaScript library for building user interfaces” rather than a framework, I think that ship has sailed: most React developers consider it to be a framework and use it as such. Or they use it as a part of a larger application framework such as NextJS, Gatsby, or RemixJS.
But what price do we pay, as web developers, for the improved developer experience provided by such frameworks? And more importantly what price, if any, do our users pay for this choice that we are making?
Recently Noam Rosenthal published two articles analyzing the common benefits and capabilities provided by various frameworks, and also their associated costs. I highly recommend checking out these articles. One of the costs that Noam mentions is the increased download size, especially JavaScript bundle sizes, that stem from the use of frameworks and other libraries. In particular, the increase in the amount of downloaded JavaScript can have a direct impact on website performance. And there are other aspects of framework usage that can impact performance as well.
In this article, I will analyze the performance cost associated with various frameworks, based on field data collected by the Google Chrome User Experience Report, or CrUX for short. I think this information is both interesting and useful, in particular given the wide variety of framework and platform choices currently available to front-end and fullstack developers.
However, when reviewing this data, it’s important not to conflate correlation and causation. Just because webpages built using a particular framework more often have better or poorer performance than another framework doesn’t mean that the framework itself is always at fault. For example, it could be because certain frameworks are more commonly used for building heavier websites.
That said, this data can assist in making informed decisions about which framework to choose when implementing front-end projects. When possible, I would prefer frameworks that have a higher good performance ratio.
Collecting Core Web Vitals From The Field
As I previously mentioned, my primary data source for this analysis is Google CrUX. CrUX is a cloud-based database into which Real User Measurements (RUM) are collected from live Chrome browser sessions. If you have opted-in to syncing browsing history, have not set up a Sync passphrase, and have usage statistics reporting enabled then whenever you load a webpage using Chrome, information about your session is automatically reported to CrUX. In particular, the collected measurements include the three Core Web Vitals metrics measured for each session.
In recent years, these metrics have become the cornerstone of modern Web performance analysis:
For each such metric, Google has defined ranges that can be considered good (green), average / needs improvement (orange), and poor (red).
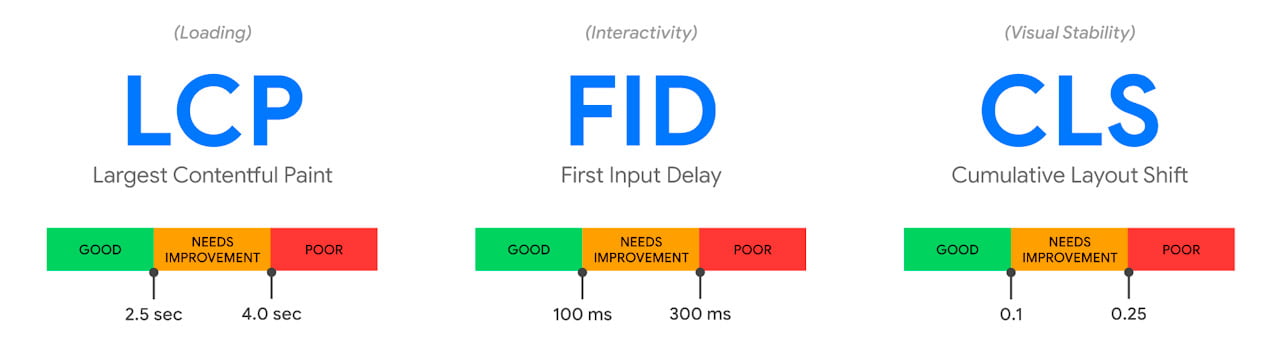
Starting in June 2021, these metrics have become a ranking factor for Google search. This also increases their importance.
In addition to collecting field data for each such session, synthetic measurements are performed on the websites, using the WebPageTest tool. These lab measurements are collected into another online repository called the HTTP Archive. This includes analyzing which technologies a webpage uses, including which JavaScript frameworks, using the Wappalyzer service.
Google makes it possible to execute queries on both these collections using its BigQuery project. However, the easiest way to gain insights from this data is to use the Core Web Vitals Technology Report created by Rick Viscomi. (Rick is Staff DevRel Engineer at Google and manages both CrUX and the HTTP Archive.) This report provides a means of interactively graphing performance-related data for various web-based platforms and technologies and easily compares them to each other.
For this article, I primarily rely on insights gained from analyzing data presented using the Core Web Vitals Technology Report.
There are a few caveats to note when analyzing this data:
- While field data is collected by page, the Technology Report displays it per origin. The origin value is an aggregate of the values of all the pages for that origin, computed as a weighted average based on page traffic.
- On the other hand, the ratios of good origins are not weighted. This means that an origin that has relatively little traffic, but sufficient to be included in the dataset, is counted equally to a very popular, high-traffic origin. This aspect of the computation can be mitigated by filtering origins by popularity ranking
- HTTP Archive only analyzes the homepage for each origin. This means that the framework determination is only made for the home page, and all other pages belonging to that origin are aggregated for it, regardless of if they use it or not, or even if they use some other framework.
- Subdomains are measured as distinct origins.
Comparing CWV Of JavaScript Frameworks
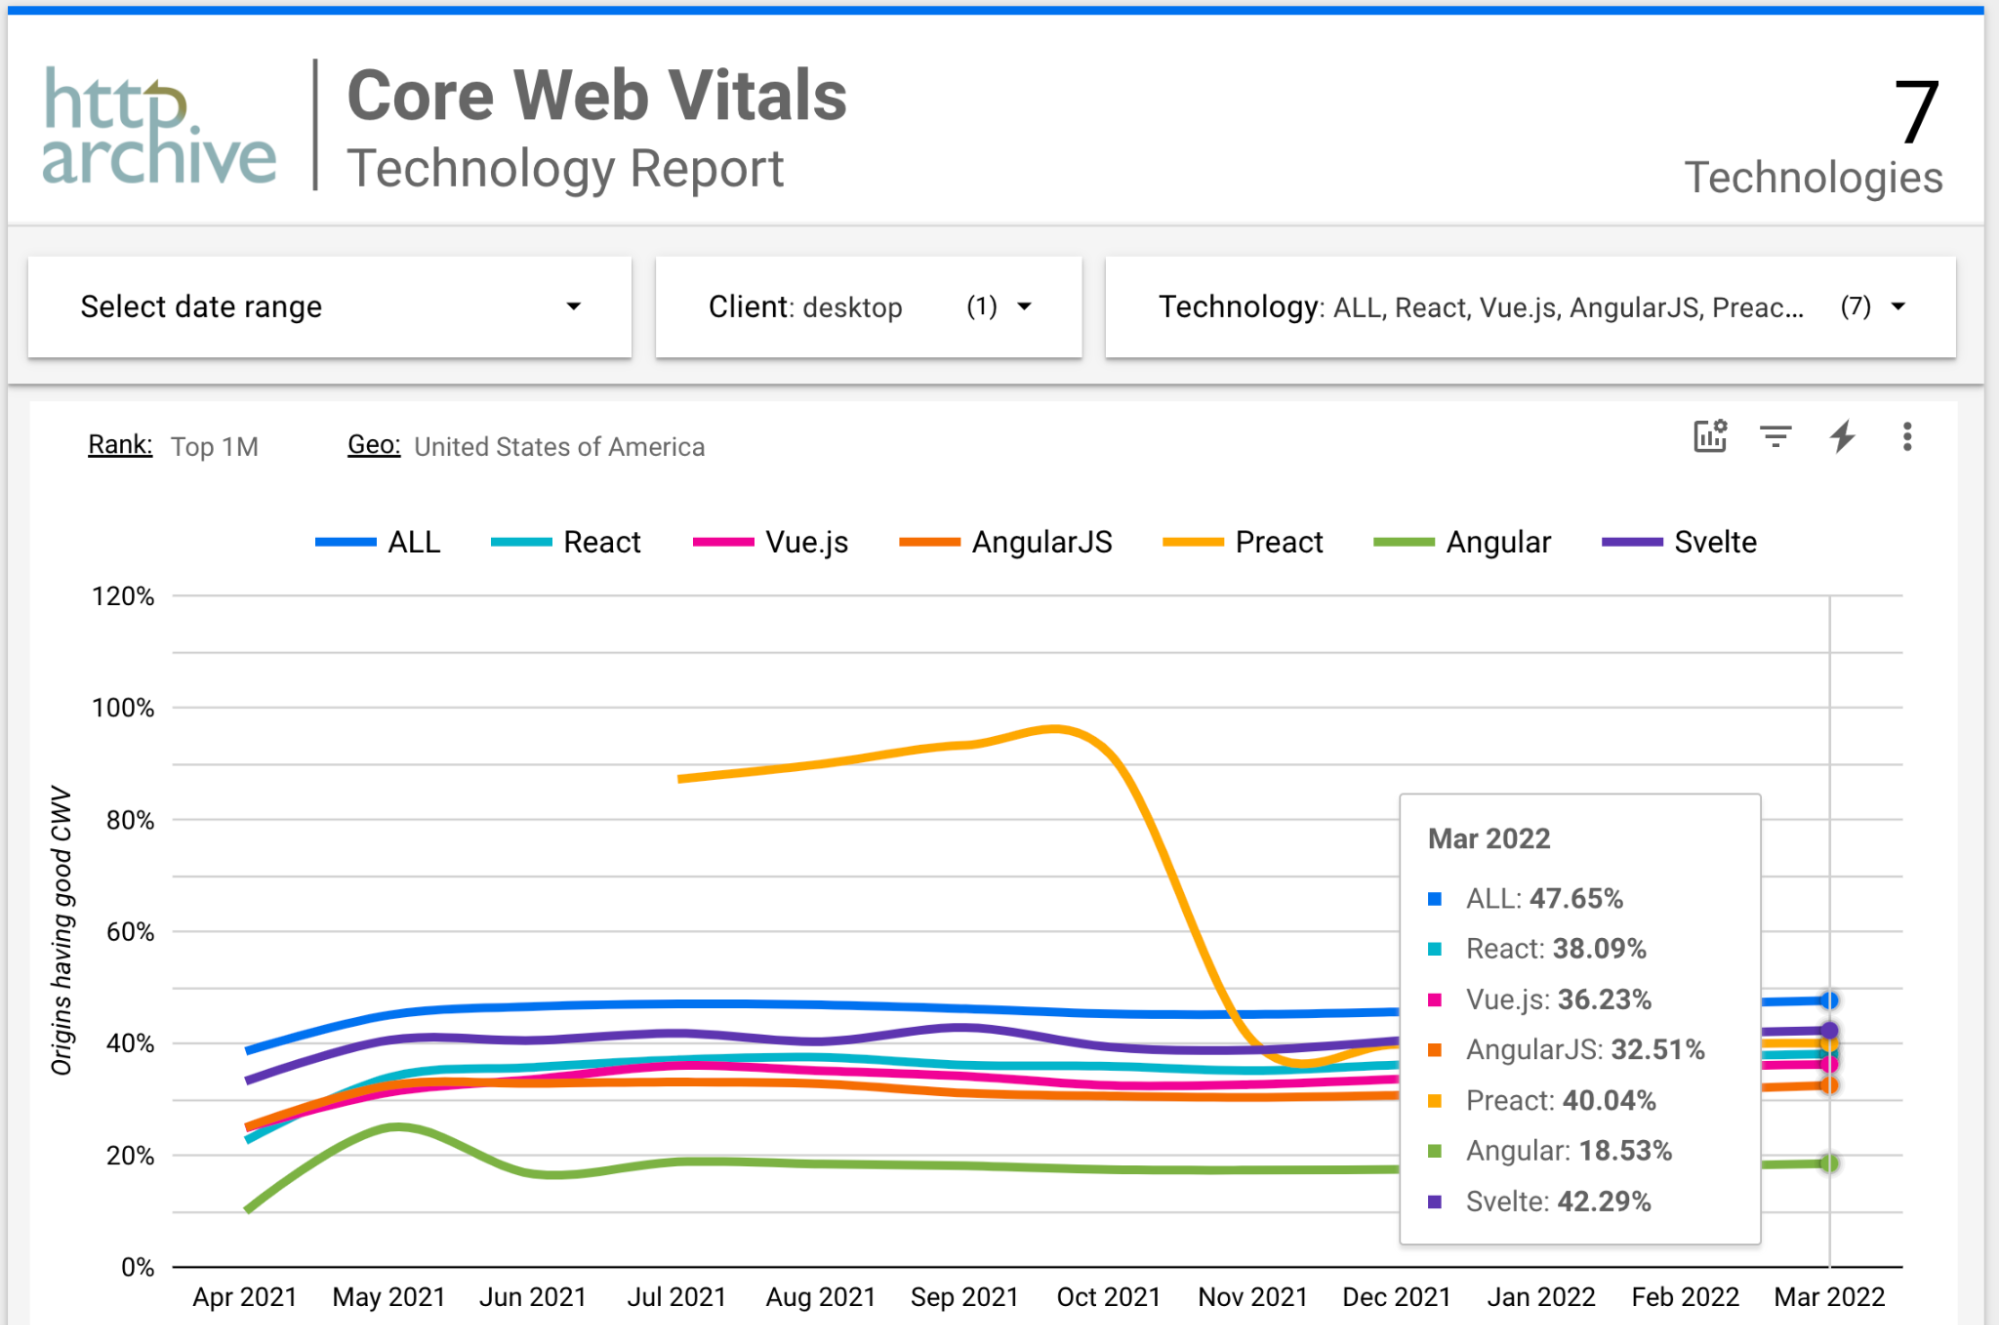
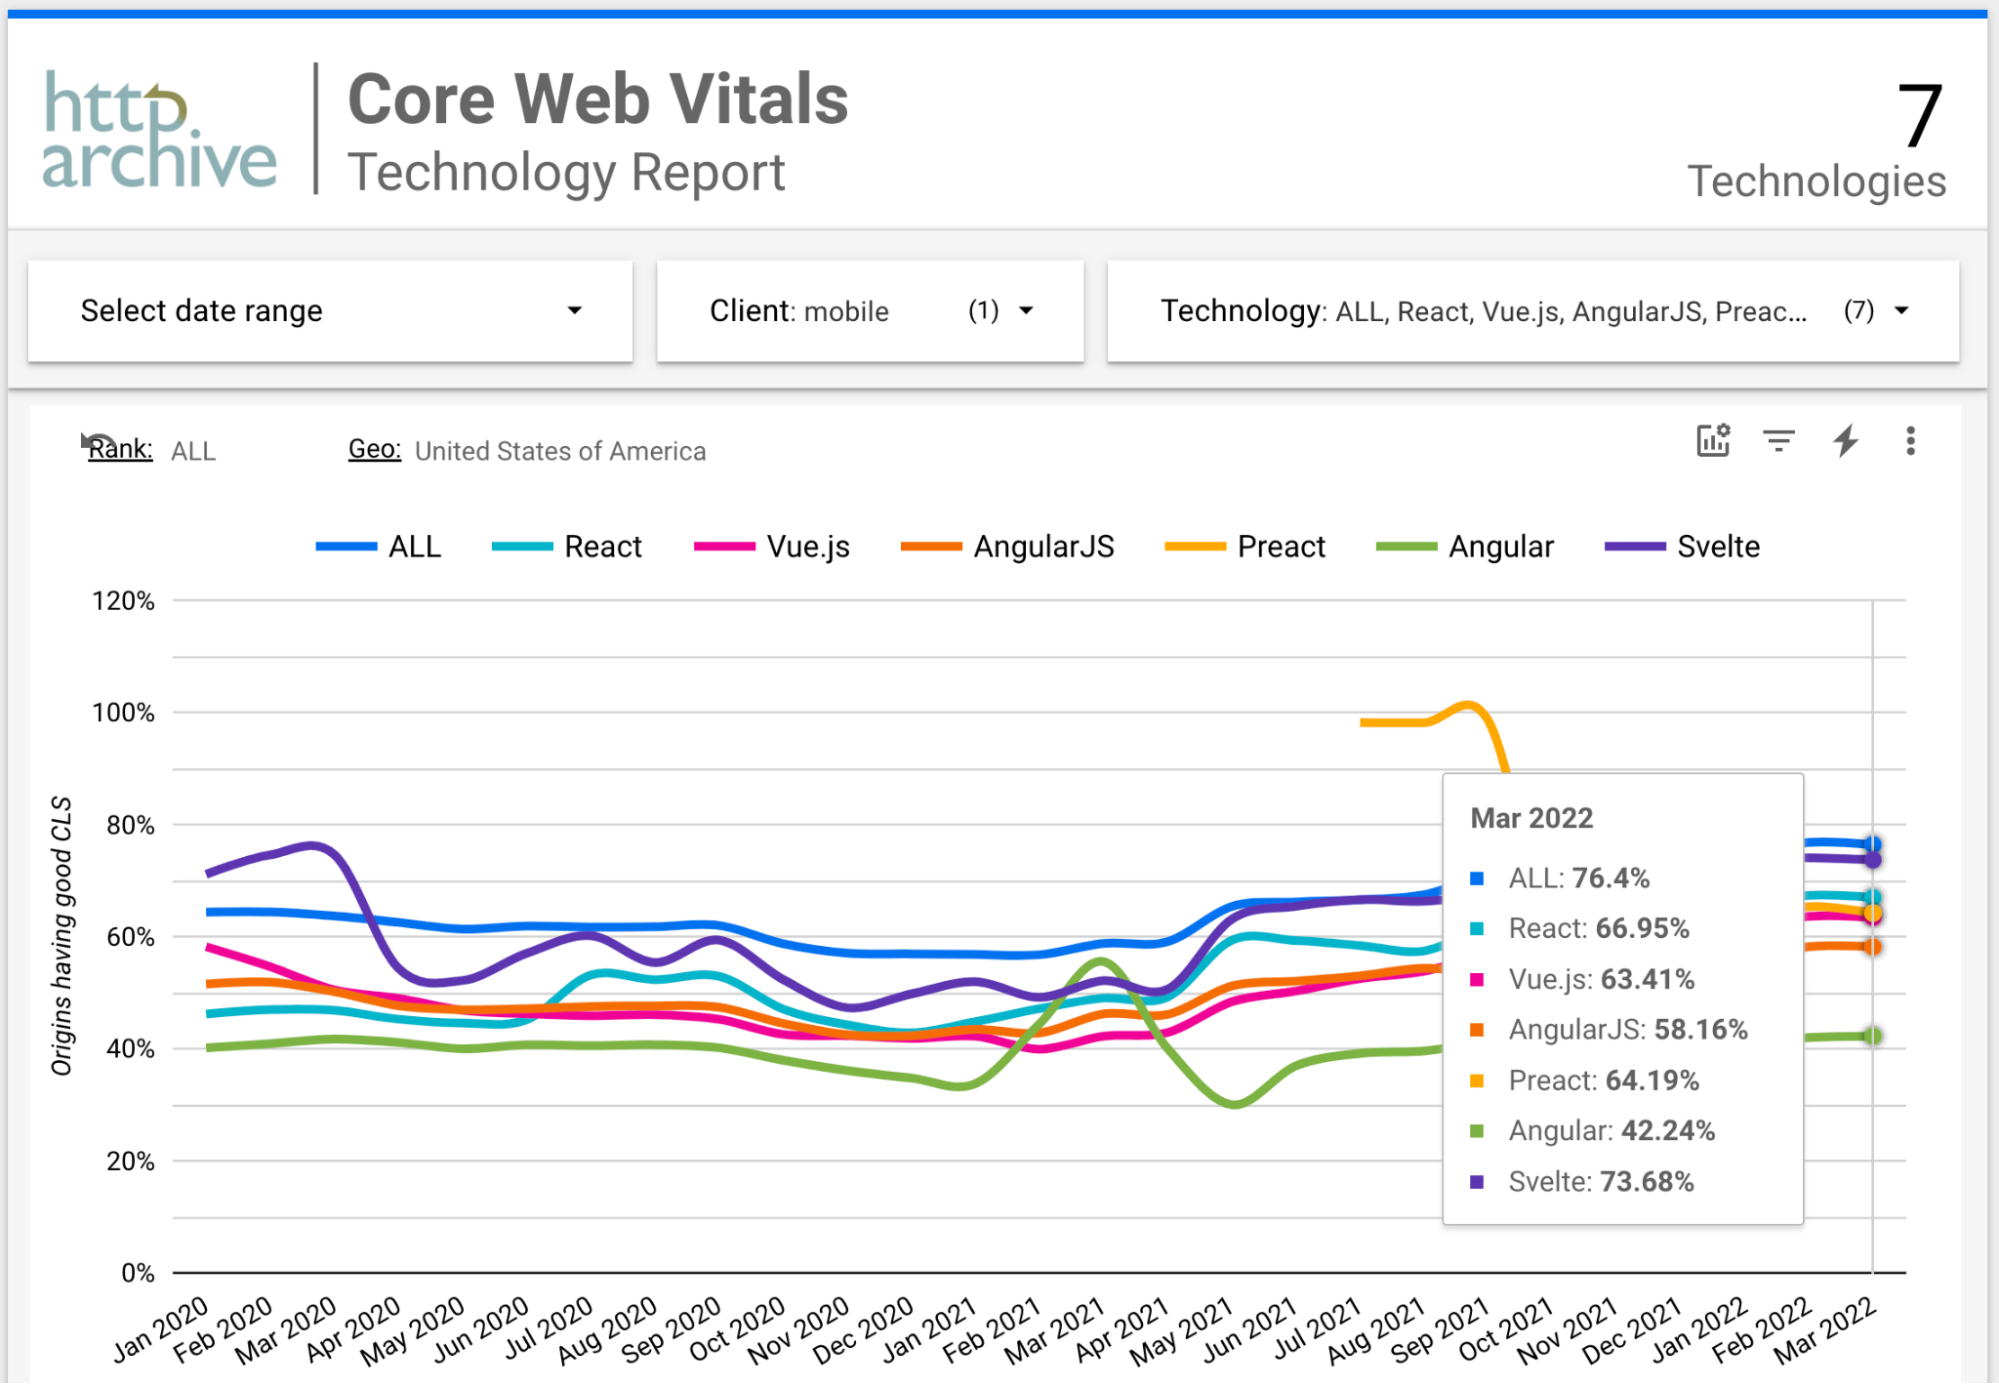
Let’s start by comparing the performance of various JavaScript frameworks. Specifically the ratio of websites built using each of these frameworks that have good (green) scores for all three CWV metrics out of the total sites built using them. Sites that have good scores for all three CWV metrics should provide a better user experience in terms of performance, and are also eligible for the maximum Google search ranking boost.
I have filtered the data to include only sessions in the USA in order to eliminate the impact of different geographical distributions between the different frameworks. The ALL line in the graphs refers to all websites in CrUX, not just those that use frameworks, and is used as a reference for comparison.
Note: Mobile in this case does not include iOS devices, such as iPhone. This is because Chrome on iOS is just a thin wrapper around a Safari core, and does not measure or report CWV. (This is true for all browsers on iOS — they are all just Safari on the inside.)
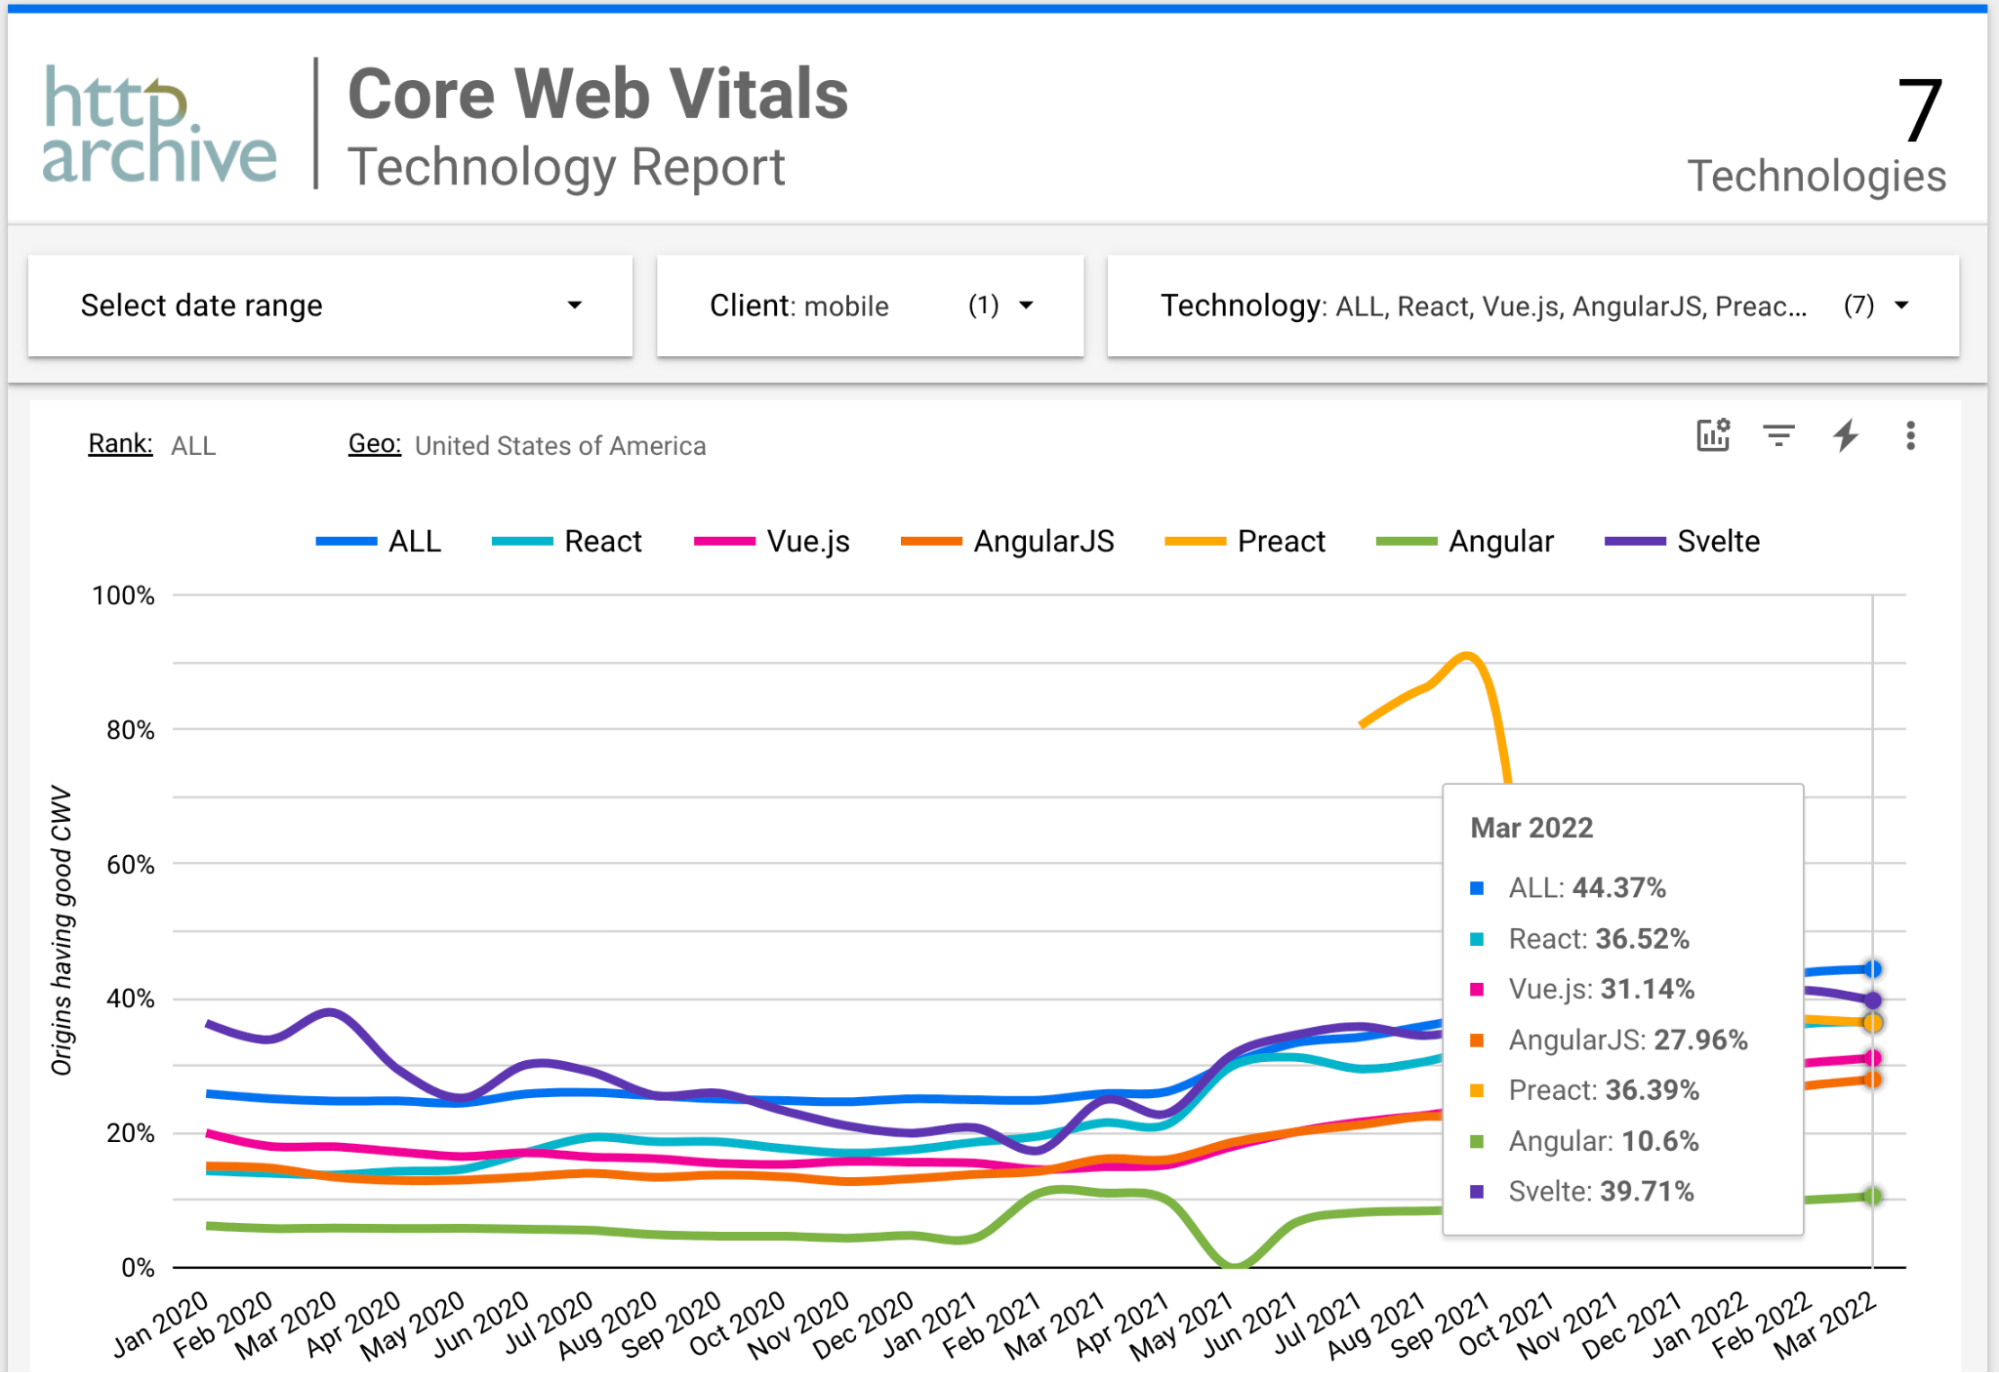
First of all, we can see that different frameworks produce noticeably different results. Moreover, for better or worse, these results are mostly stable over the entire past year. (Preact is an exception to this, and I will explain the cause of this variation shortly.) This indicates that scores are meaningful, and not flukes, or results of statistical anomalies.
Based on these measurements, as Noam Rosenthal’s article indicates, using frameworks does come at a performance cost: by comparing to the ALL baseline we see that websites built using any of these frameworks are generally less likely to have good CWV than websites built without frameworks. While some frameworks like React, Preact and Svelte do come close to the overall average, it is interesting to note that none of the frameworks provide significantly better performance than the others.
React and Preact are essentially neck and neck — some may be surprised by this given how much smaller Preact is than React: approximately 4KB download vs 32KB (minified and gzipped in both cases). Apparently that 28KB download difference is not so significant in most cases. Jason Miller, the creator of Preact recently had this to say about it:
Preact isn't associated with any specific SSR or serving solutions, which dominate the impact on CWV. While Preact usage may have some correlation to CWV (really only FID), it is nowhere near as direct as tech choices involved in page delivery.
— Jason Miller 🦊⚛ (@_developit) February 11, 2022
I’ll inspect the impact of Server-Side Rendering (SSR) and also Static Site Generation (SSG) as page generation/delivery options in more detail later on in this article.
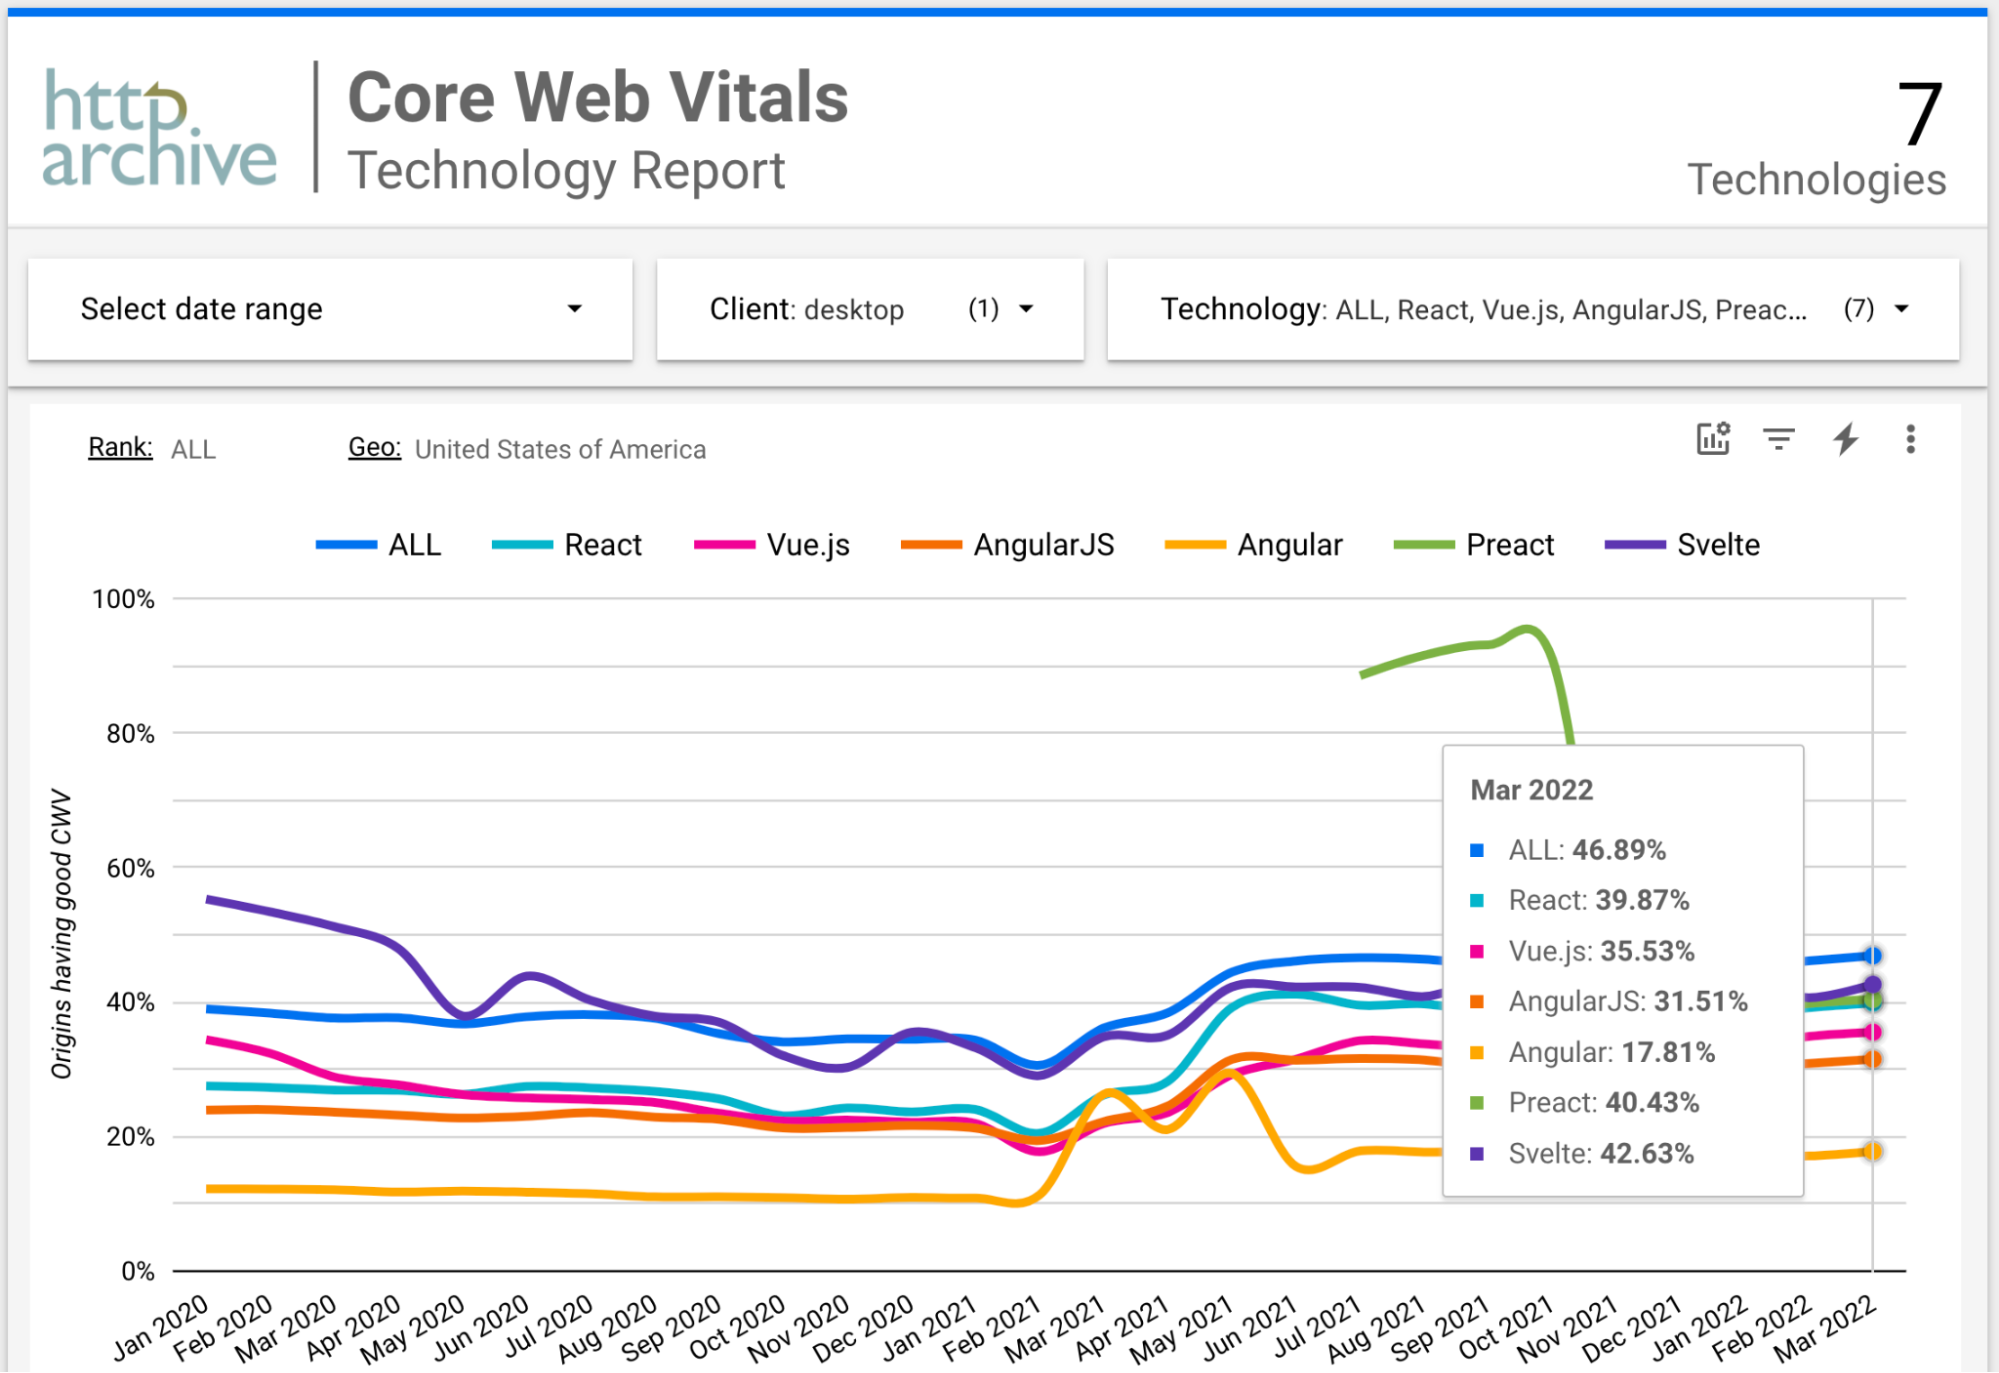
Vue and AngularJS are both in a second-tier — approximately 20-25% less likely to get good CWV on mobile, and 15-20% less likely on desktop. (Again, excluding iOS.) That said, Vue appears to be gaining ground and slowly reducing the gap with React in terms of performance.
The big dip in Preact performance is not related to any change in the framework itself or its usage. Rather it has to do with Preact’s identification by Wappalyzer. Unfortunately, this service missed most uses of Preact prior to November 2021. As a result, the earlier results for Preact should be ignored as being invalid.
Checking Top Sites
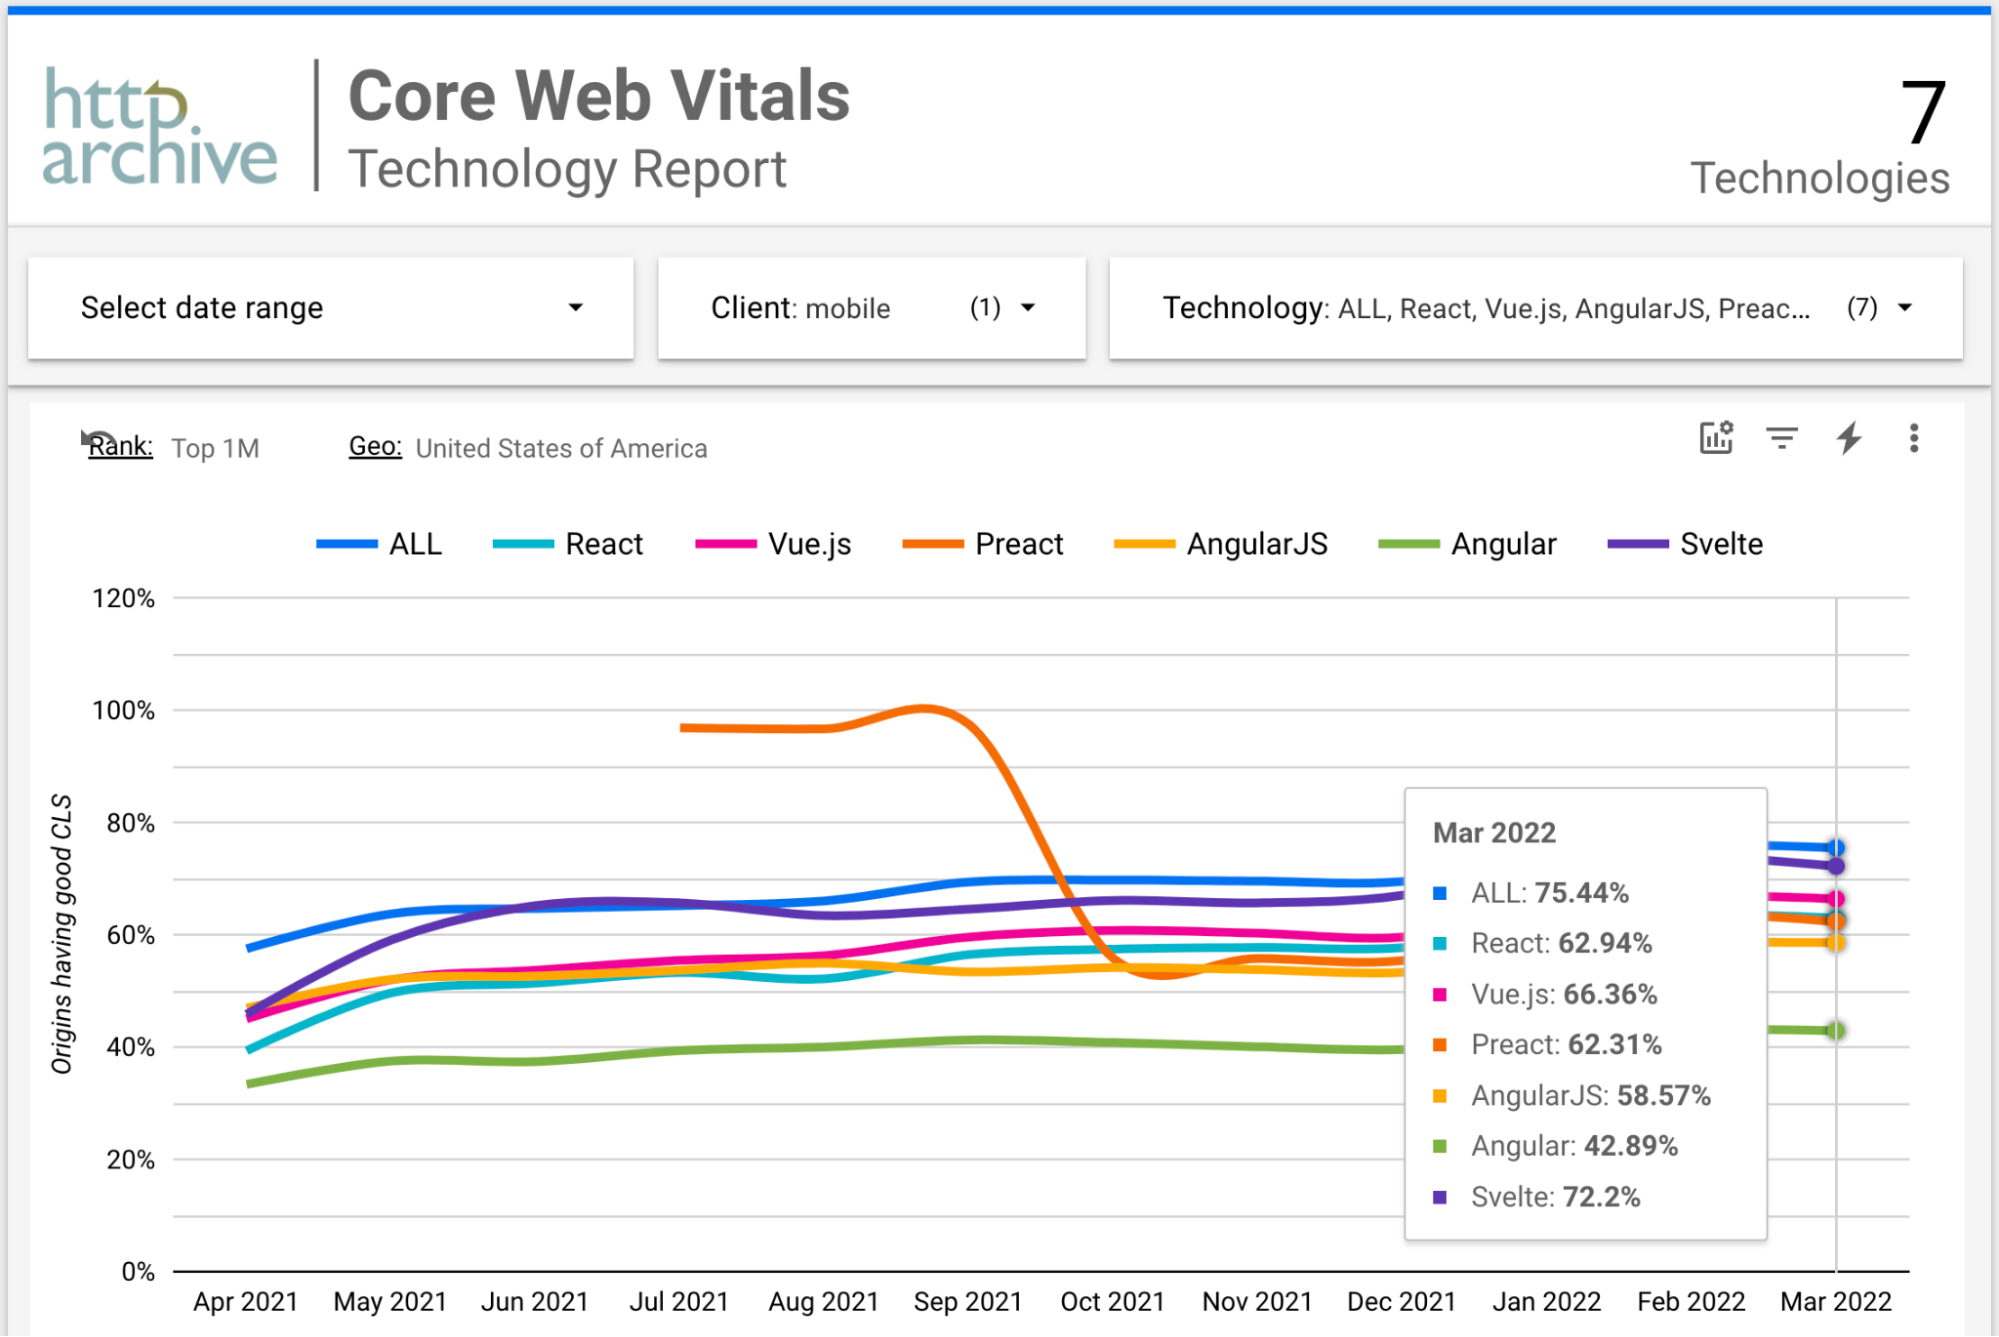
When we limit our view to only the top 1,000,000 sites in the USA (based on traffic) an interesting change is that Vue almost catches up with React because the ratio of sites having good performance using Vue goes up and for React it surprisingly goes down:
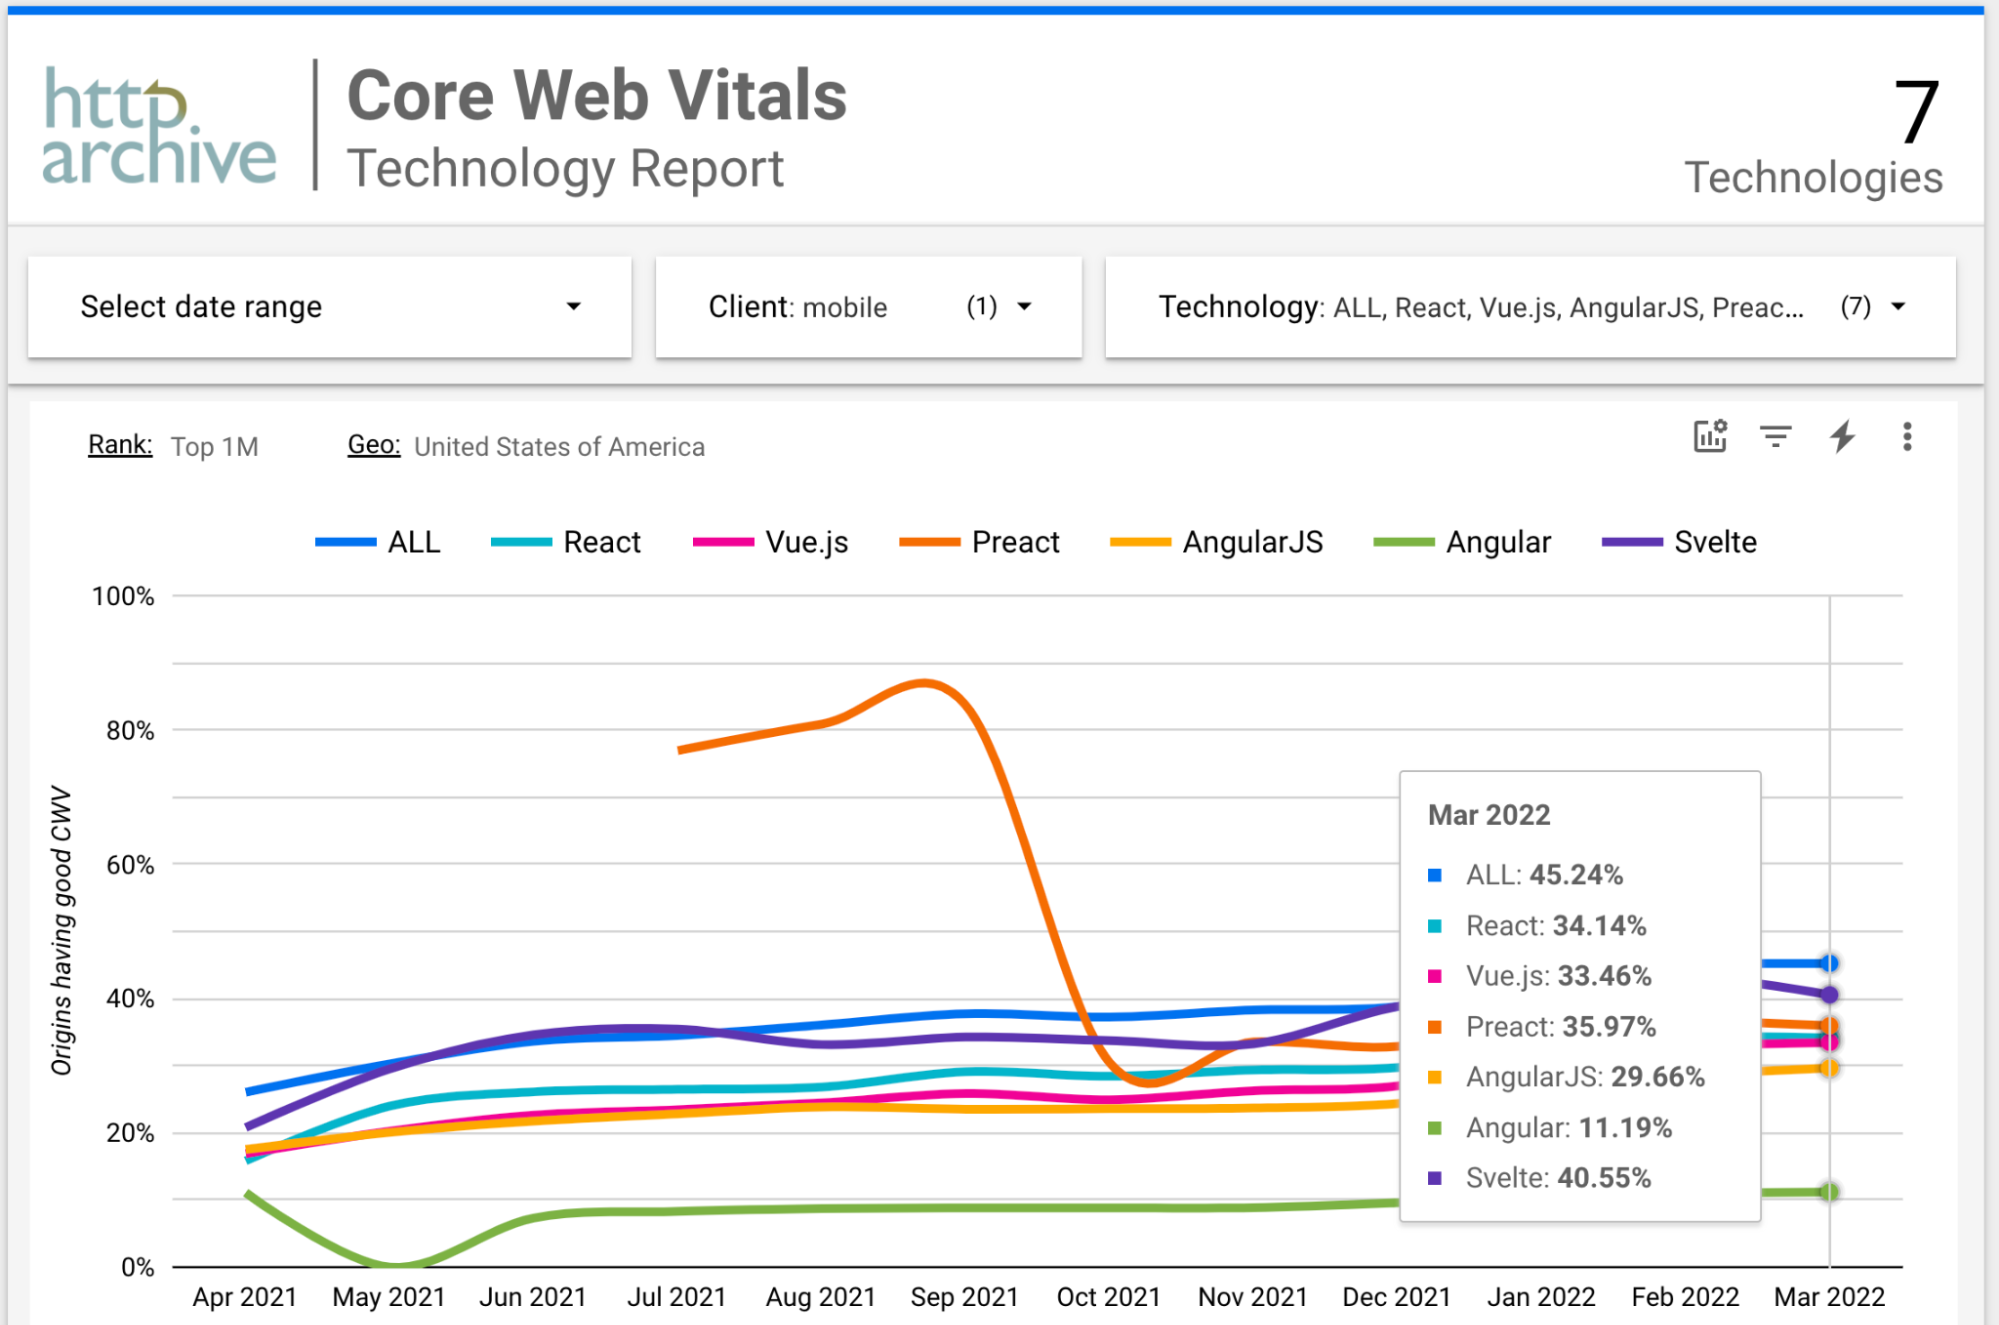
And we see the same behavior with the top 100,000 sites, with React’s ratio actually dipping lower so that Vue slightly surpasses it. I didn’t try to limit the results even more because usage numbers for some frameworks dropped so low that they were no longer sufficiently statistically significant.
But looking at the numbers we do have, the fact that Vue performance improves for higher-traffic sites perhaps indicates that achieving good performance with Vue requires greater expertise in that framework than simply being able to use it? This is because higher traffic sites are more likely to be built by organizations that can afford to employ developers that have greater expertise. Moreover, larger organizations can afford to spend more on infrastructure that is optimized for performance.
On the other hand, React sites actually go down when limiting the number of sites measured by traffic.
"Why is it that React developers with greater expertise are apparently less likely to produce fast loading websites?"
Well, that’s a very interesting mystery that I will try to solve.
Analyzing Per Metric
In addition to examining CWV as a whole, the Technology Report also makes it possible to examine each metric individually. Let’s start by looking at FID:
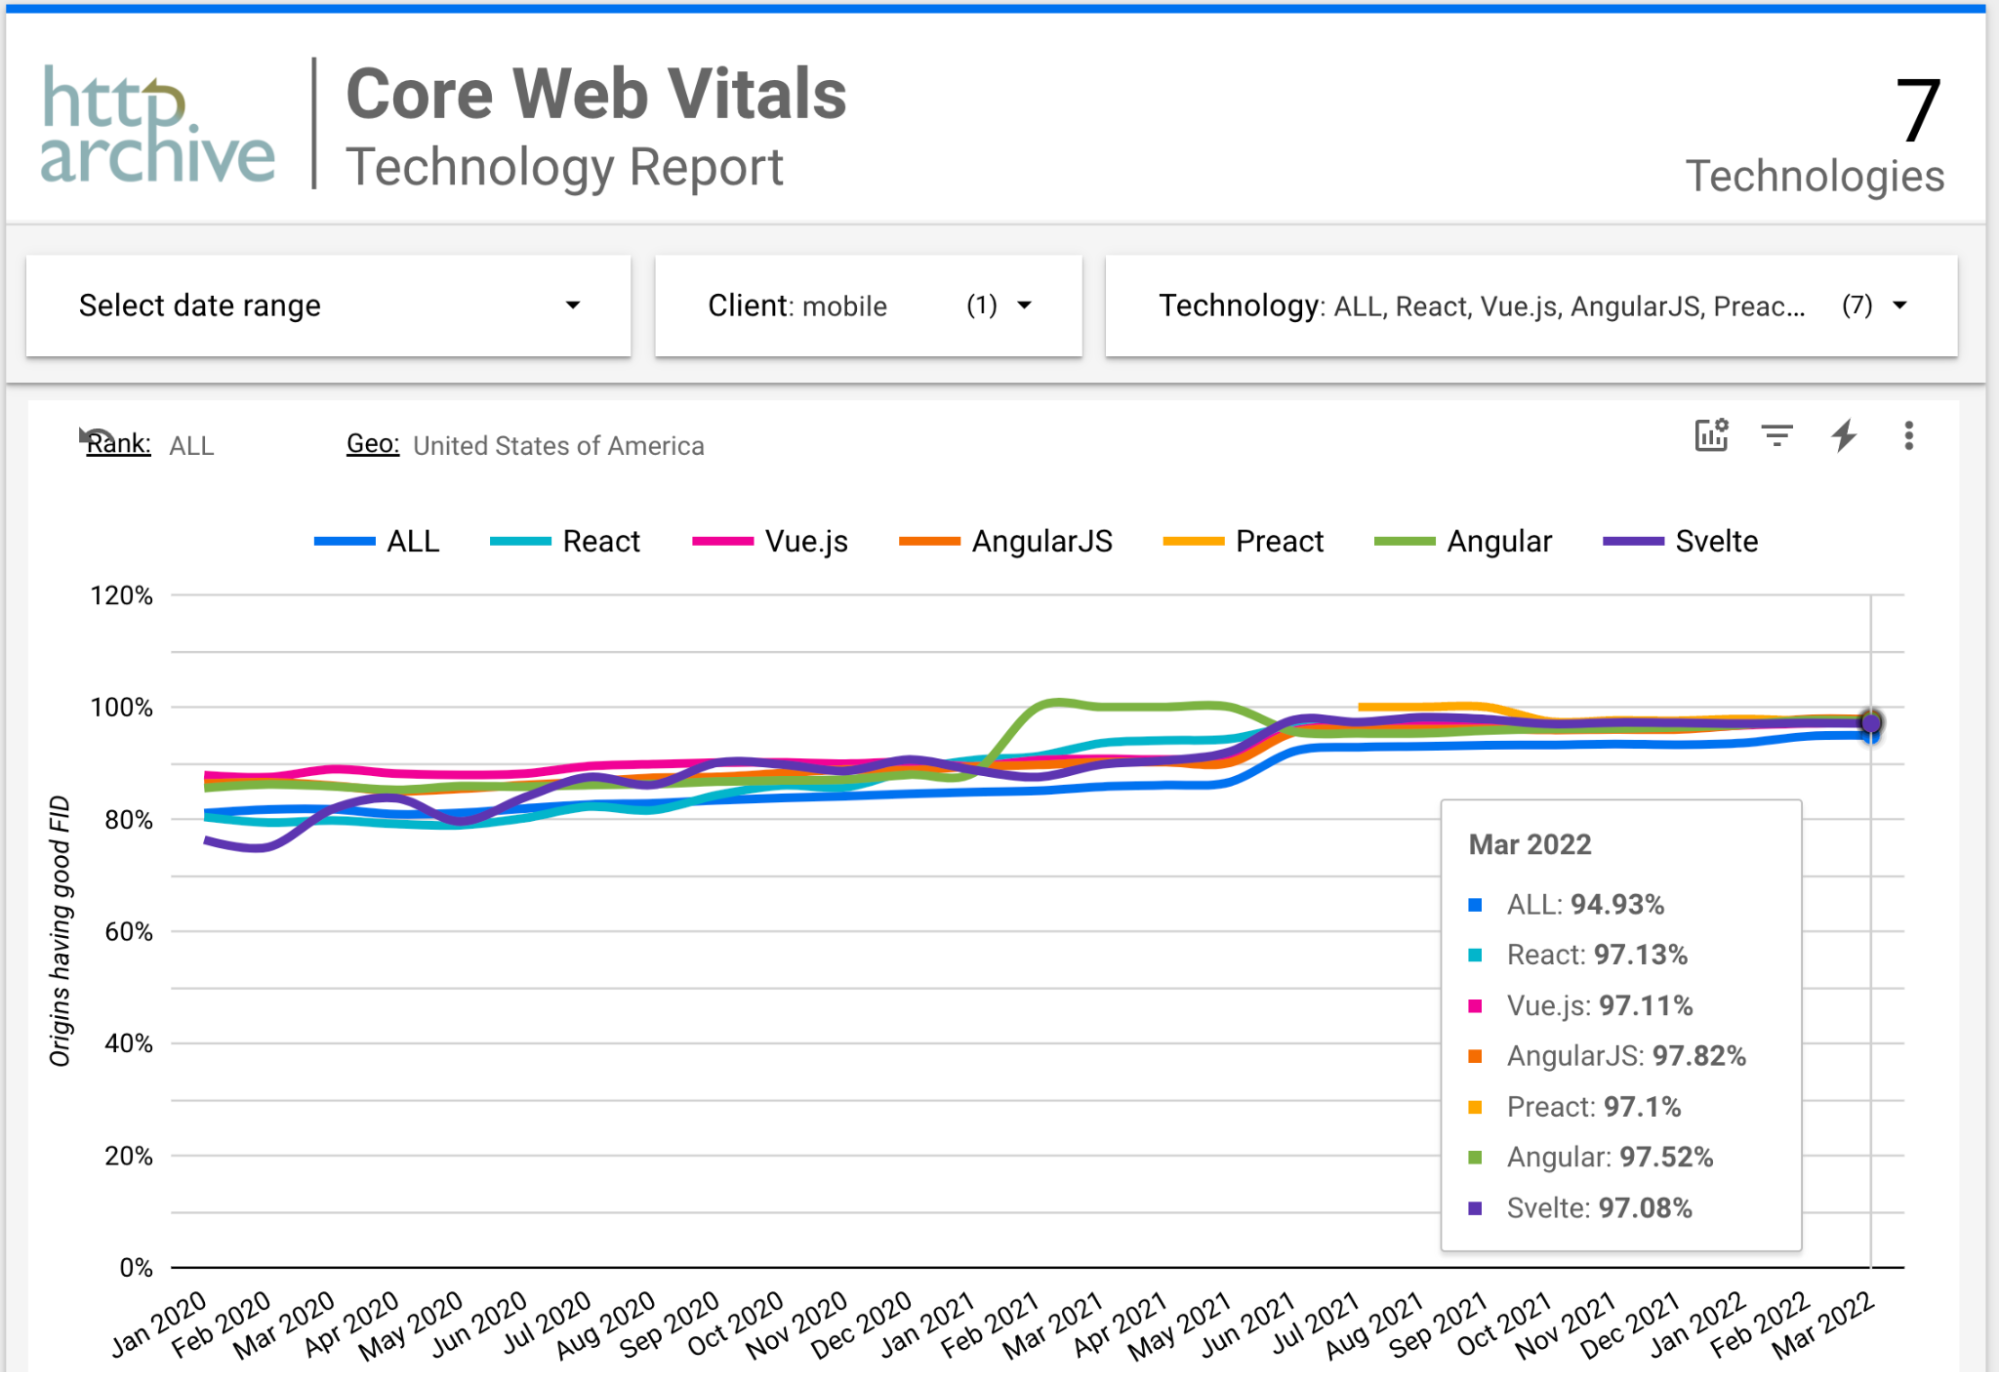
You might have expected that websites using frameworks would pay a penalty in the responsiveness metric, as it’s the one that should be the most impacted by the significant use of JavaScript. But, in practice, this is not the case. In fact, the FID metric is essentially meaningless, with all frameworks achieving a nearly perfect score.
The same is true even when looking at the aggregation of all websites in the collection. For this reason, Google is researching a better responsiveness metric and is requesting feedback for the experimental metric they’re already testing.
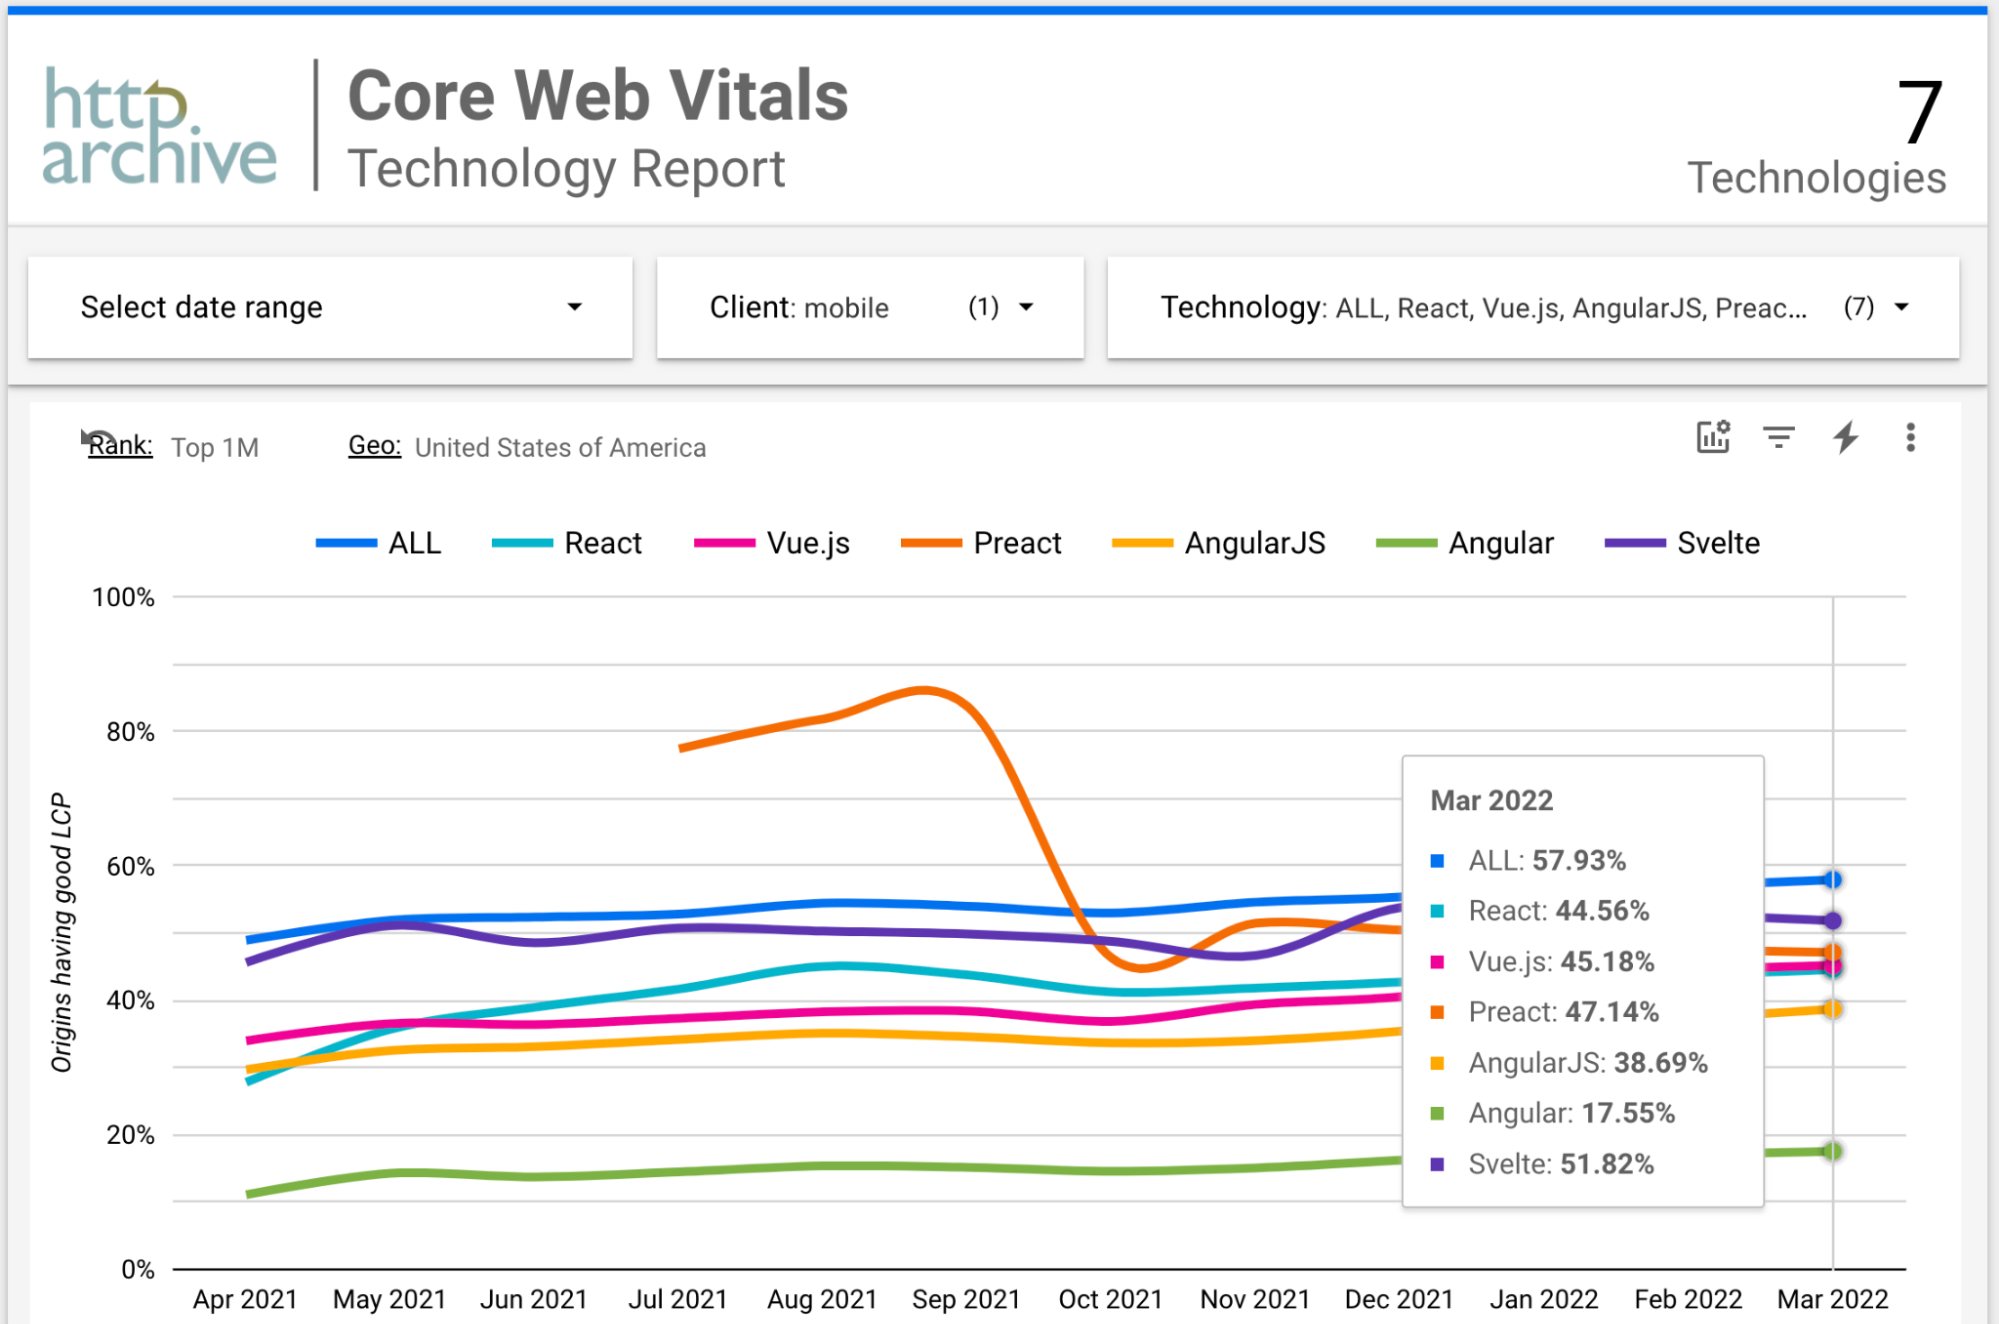
Examining the LCP metric is much more meaningful:
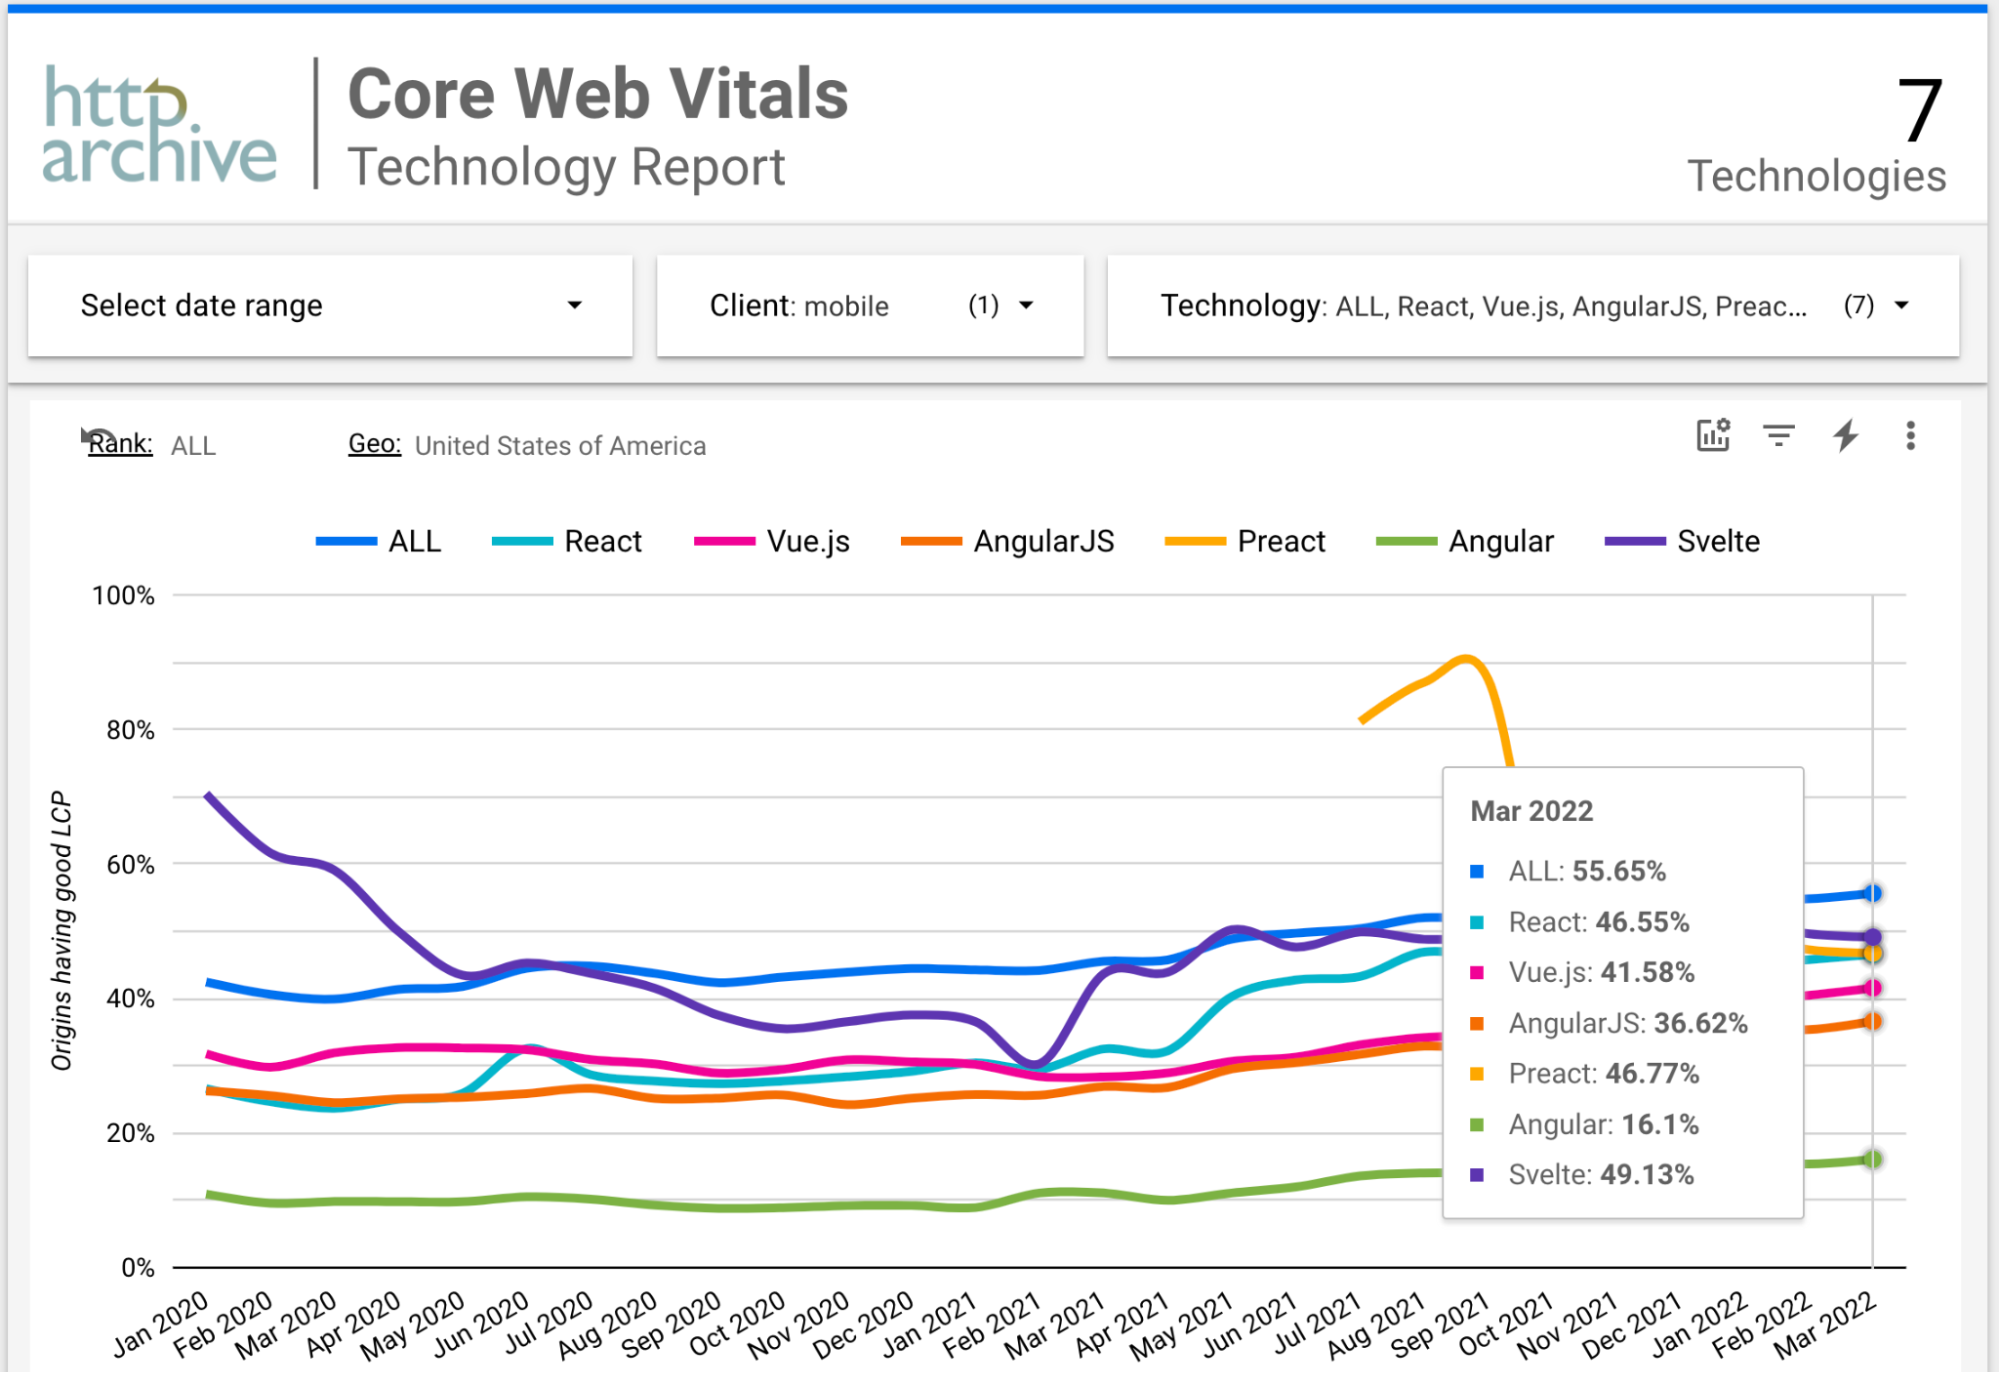
Interestingly, LCP scores are a strong match for CWV as a whole, but more spread out: ALL, React, Preact, and Svelte are approximately 10% higher, while Vue and AngularJS remain essentially the same. But when we limit to the top 1,000,000 sites we see Preact and Svelte improve some more, but React doesn’t. As a result, Vue catches up with it.
Finally let’s look at CLS, starting with all websites:
And for the top 1,000,000 websites:
Here we see both React and Preact, especially React, going substantially down, resulting in Vue surpassing both of them.
In other words, for Vue, both the ratio of good LCP and CLS improve when we check top sites only. For React, on the other hand, LCP remains mostly the same, while CLS actually degrades.
This could indicate that a reason for the performance degradation seen for top sites using React is an increase in the amount of ads on pages. Ads often adversely impact CLS because as they appear they push other content down. However, I don’t think that’s the case because it doesn’t explain the difference in behavior between React and the other frameworks. Also, you would expect ads to impact LCP as well, but we see that LCP remains essentially the same.
To try to better understand this behavior, let’s check other webpage aspects visualized by the Technology Report.
Analyzing Additional Webpage Aspects
In addition to performance scores, the Technology Report enables analysis of resource download sizes. It’s well known that the amount of JavaScript used by a page can have a direct impact on its performance because all the code needs to be downloaded, parsed and executed. Let’s compare the amount of JavaScript downloaded by the various frameworks:
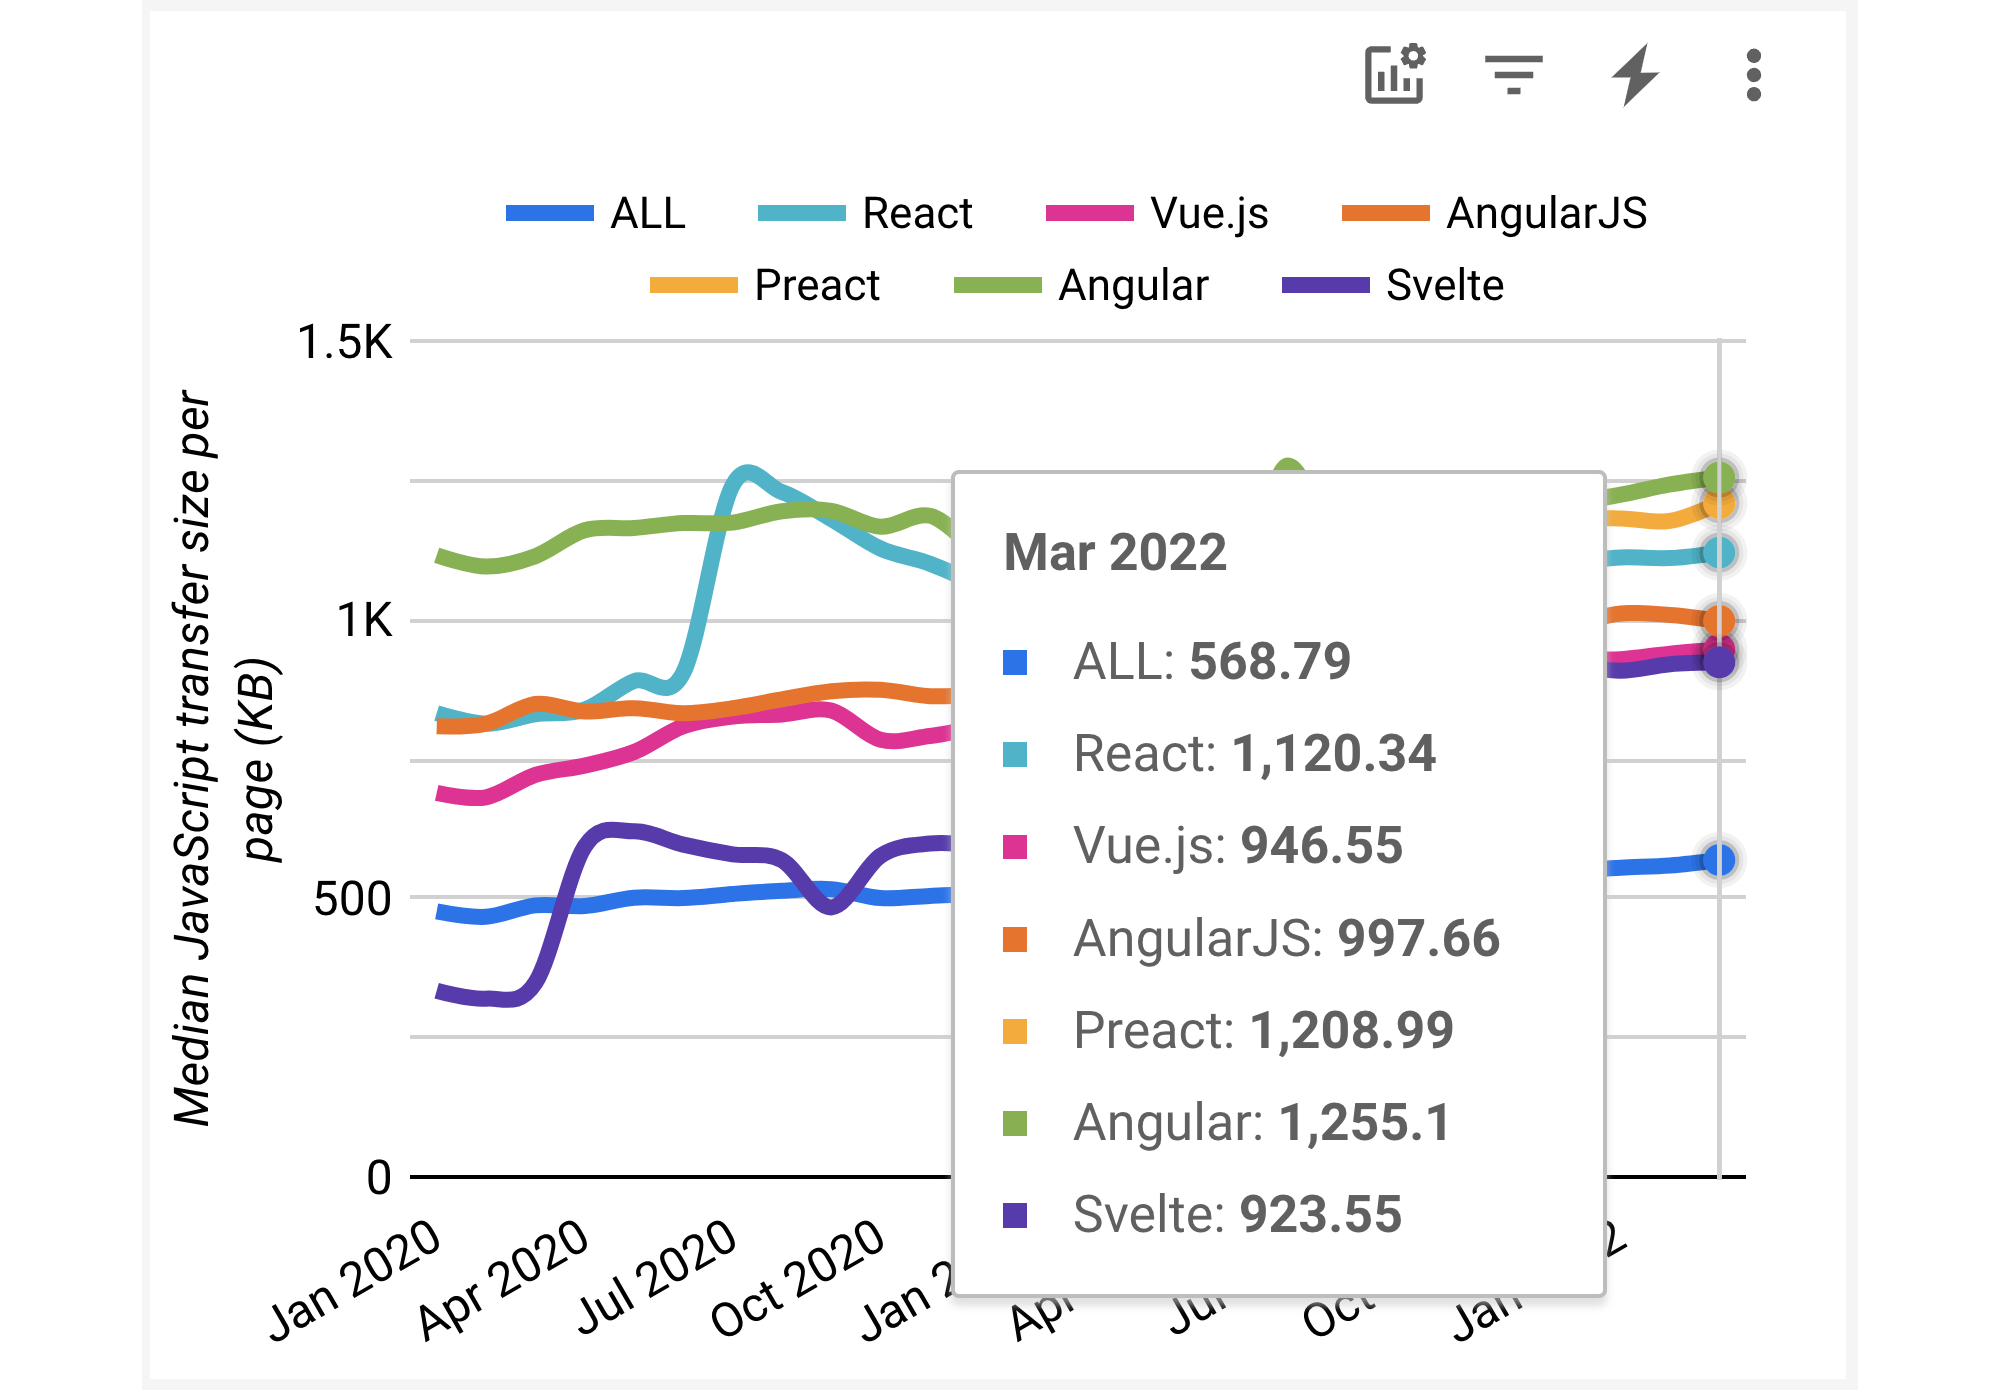
Unsurprisingly, websites that use frameworks download significantly more JavaScript than websites in general. This is due to all the functionality required for Single Page Applications (SPA), such as routing and client-side rendering.
Also unsurprisingly, websites built using Svelte download less JavaScript than any other of these frameworks. This is due to the Svelte compiler handling at build-time a lot of functionality that other frameworks need to perform at run-time. As a result, Svelte doesn’t need to deploy the code required for such functionality. It’s also possible that developers using Svelte place a greater premium on delivering lean-and-mean webpages than developers using other platforms.
That said, the 226KB difference between the median for Svelte sites and React sites only translates to a 2.4% increase in the amount of sites that have good CWV. This highlights the amazing improvement that browsers have been able to achieve in handling larger JavaScript payloads, for example by parsing the JavaScript off of the main thread, during the download. I assume that caching, both in the browser and CDNs, contributes to this as well.
It’s also interesting to note that websites and apps using Preact actually download more JavaScript than those using React. Perhaps these sites chose Preact in an effort to reduce their total weight. In any event, this may explain why we didn’t see noticeable performance improvements for Preact over React: whatever benefits Preact provides are offset by the application code itself.
When we look at the top 1,000,000 we see that the amount of JavaScript increases, with the interesting exception of Vue.
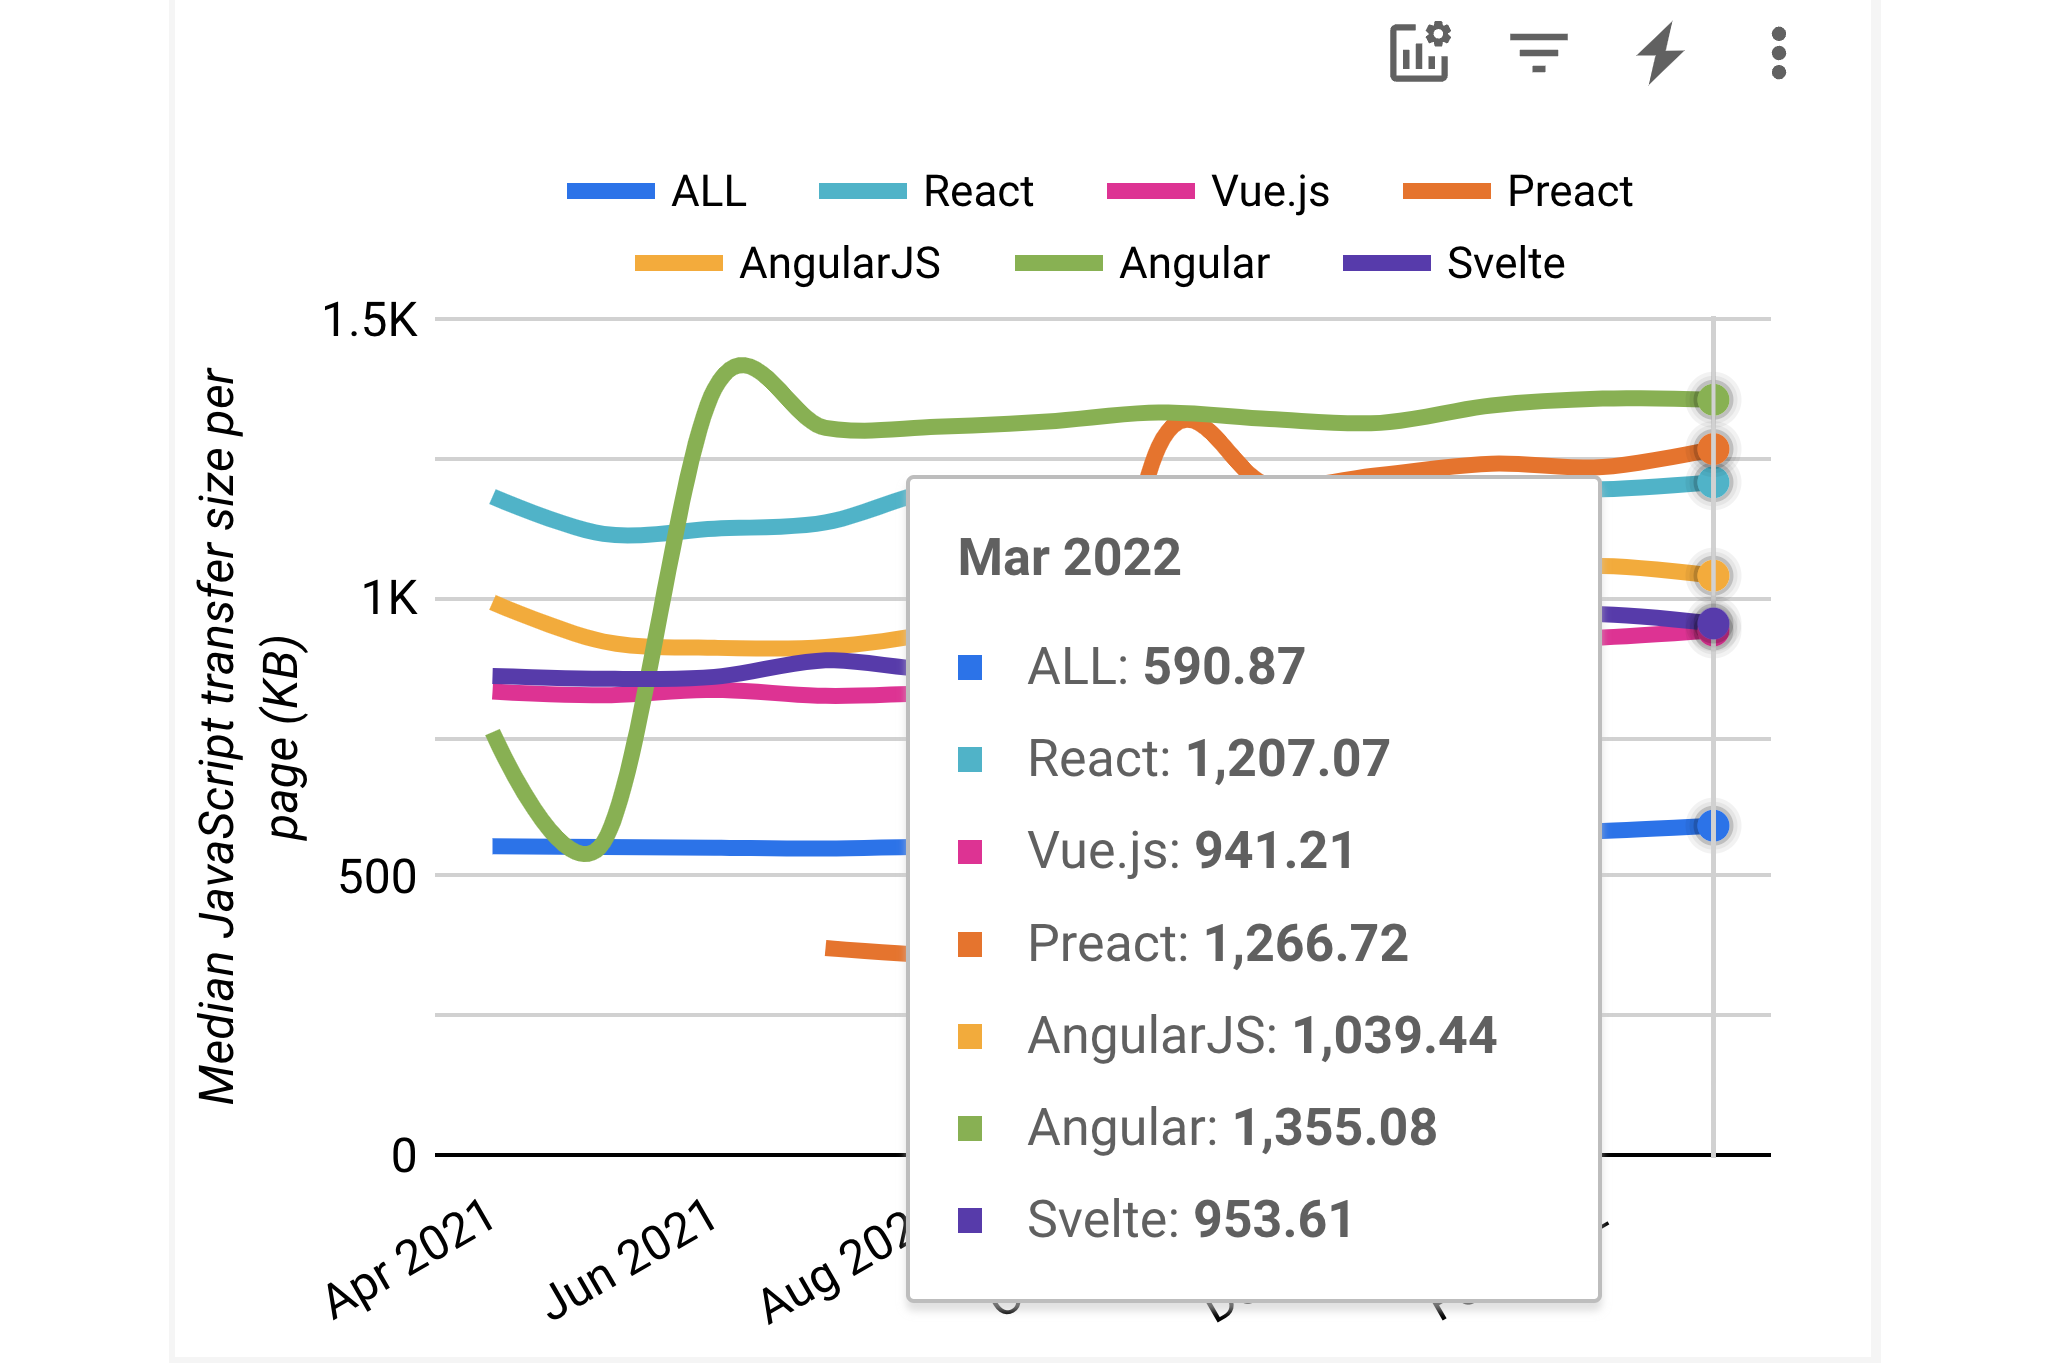
This may explain why we saw such a significant improvement for Vue for the top sites, compared to the other frameworks. In the case of those other frameworks, it appears that whatever greater expertise the developers working on top sites may have, it does not translate to reduced JavaScript download sizes. Actually, the opposite is true — perhaps due to the extra functionality provided by such websites.
Another very interesting comparison is the amount of image data downloaded:
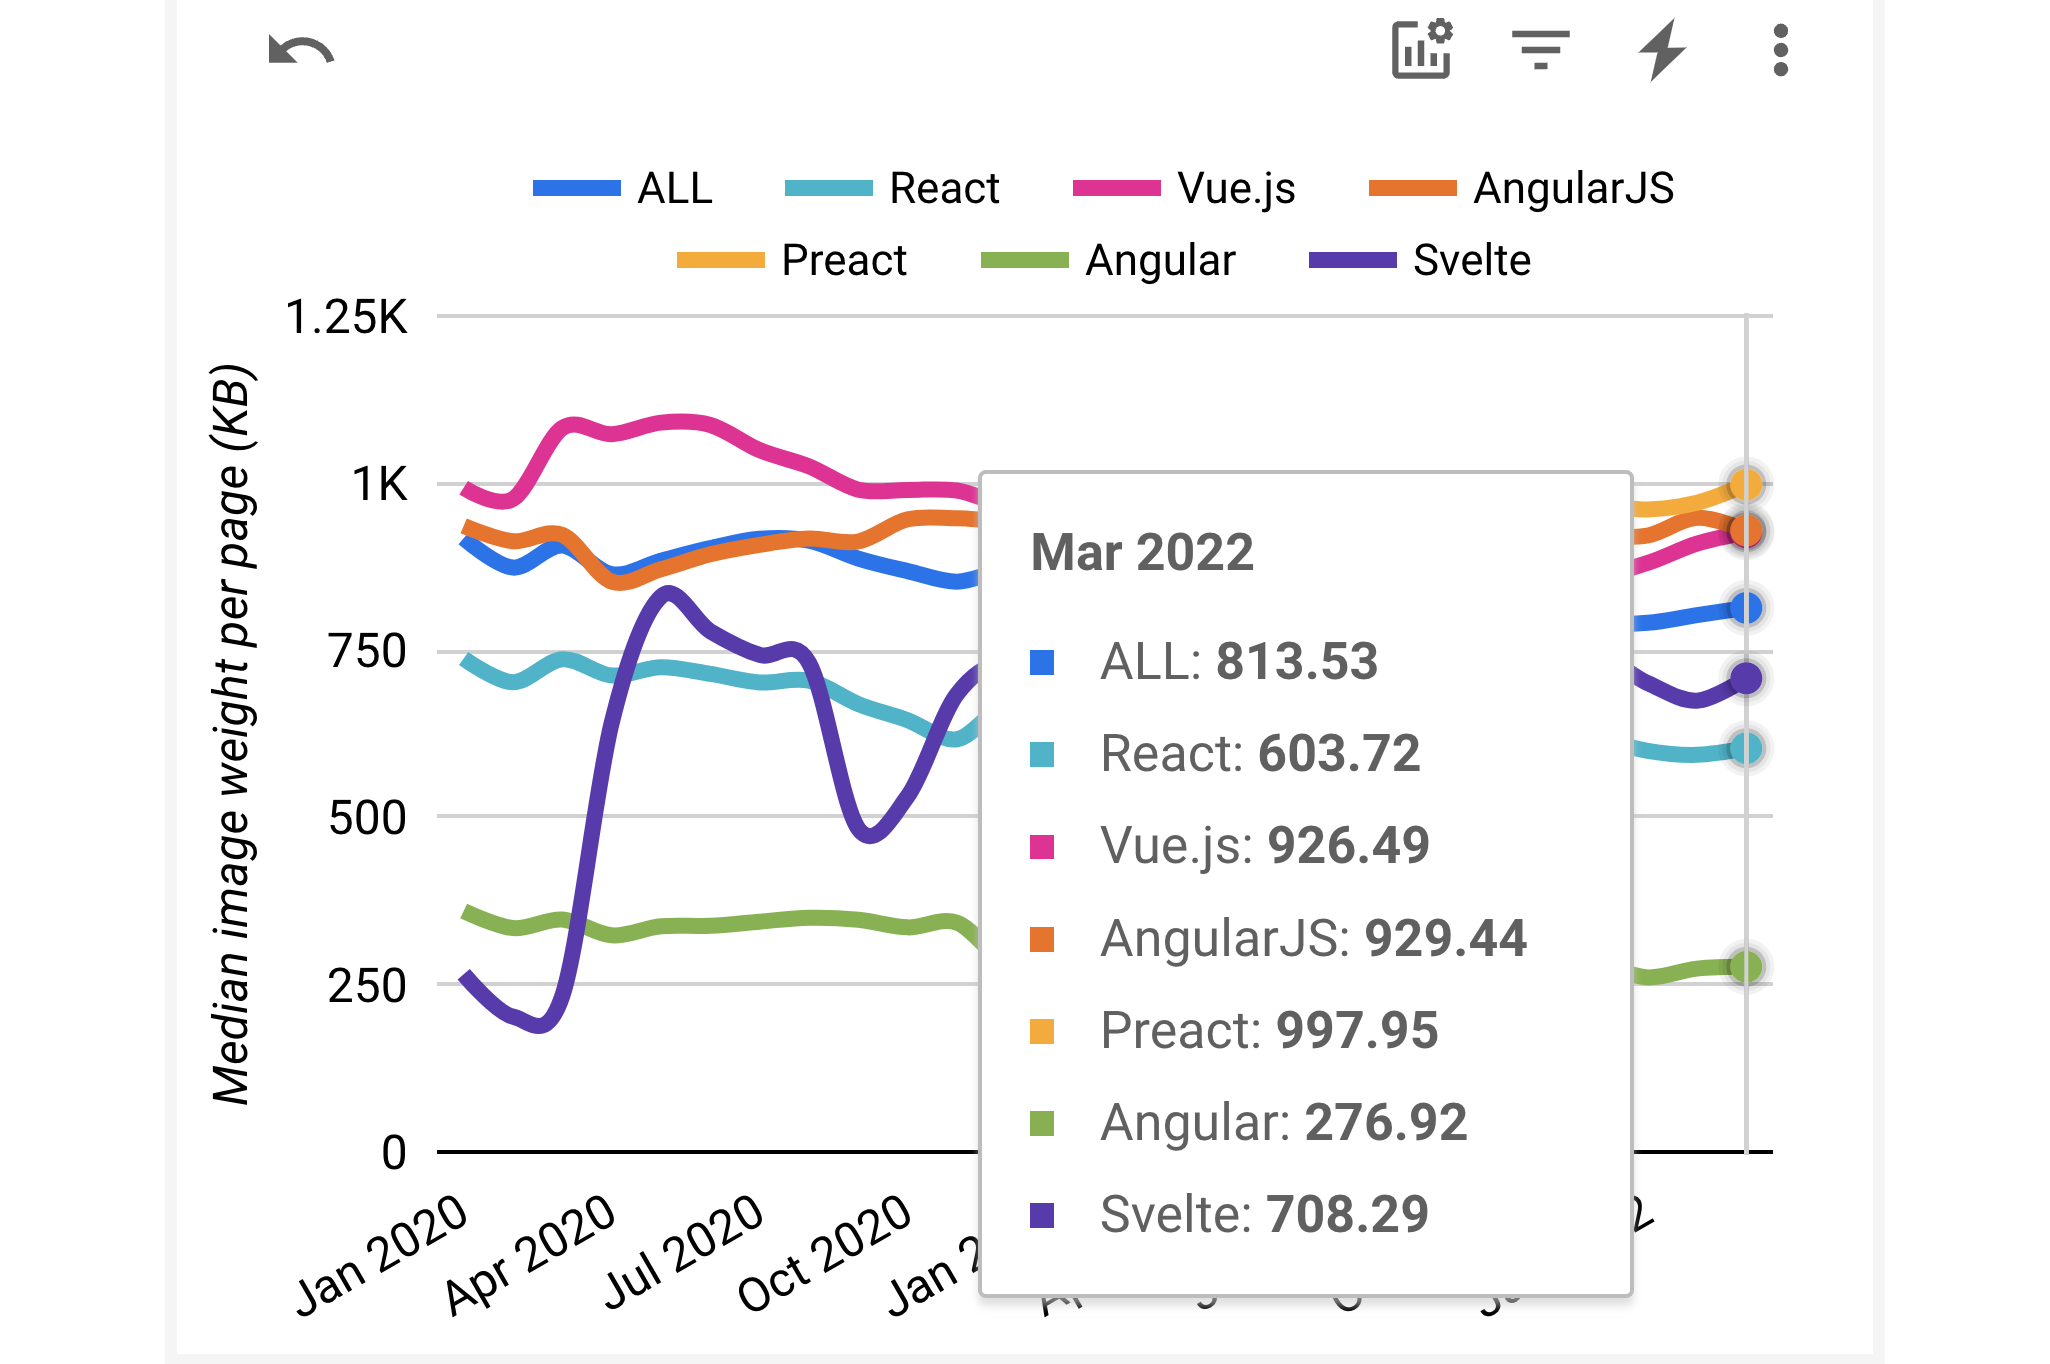
Here we see that sites built using React, Svelte and Angular download significantly less image data than websites in general. This may have to do with such sites leveraging modern techniques for reducing image downloads, such as lazy loading and newer image formats. Interestingly, Angular sites download significantly less image data than any other framework.
Looking at the top sites we see a significant increase in image downloads across the board.
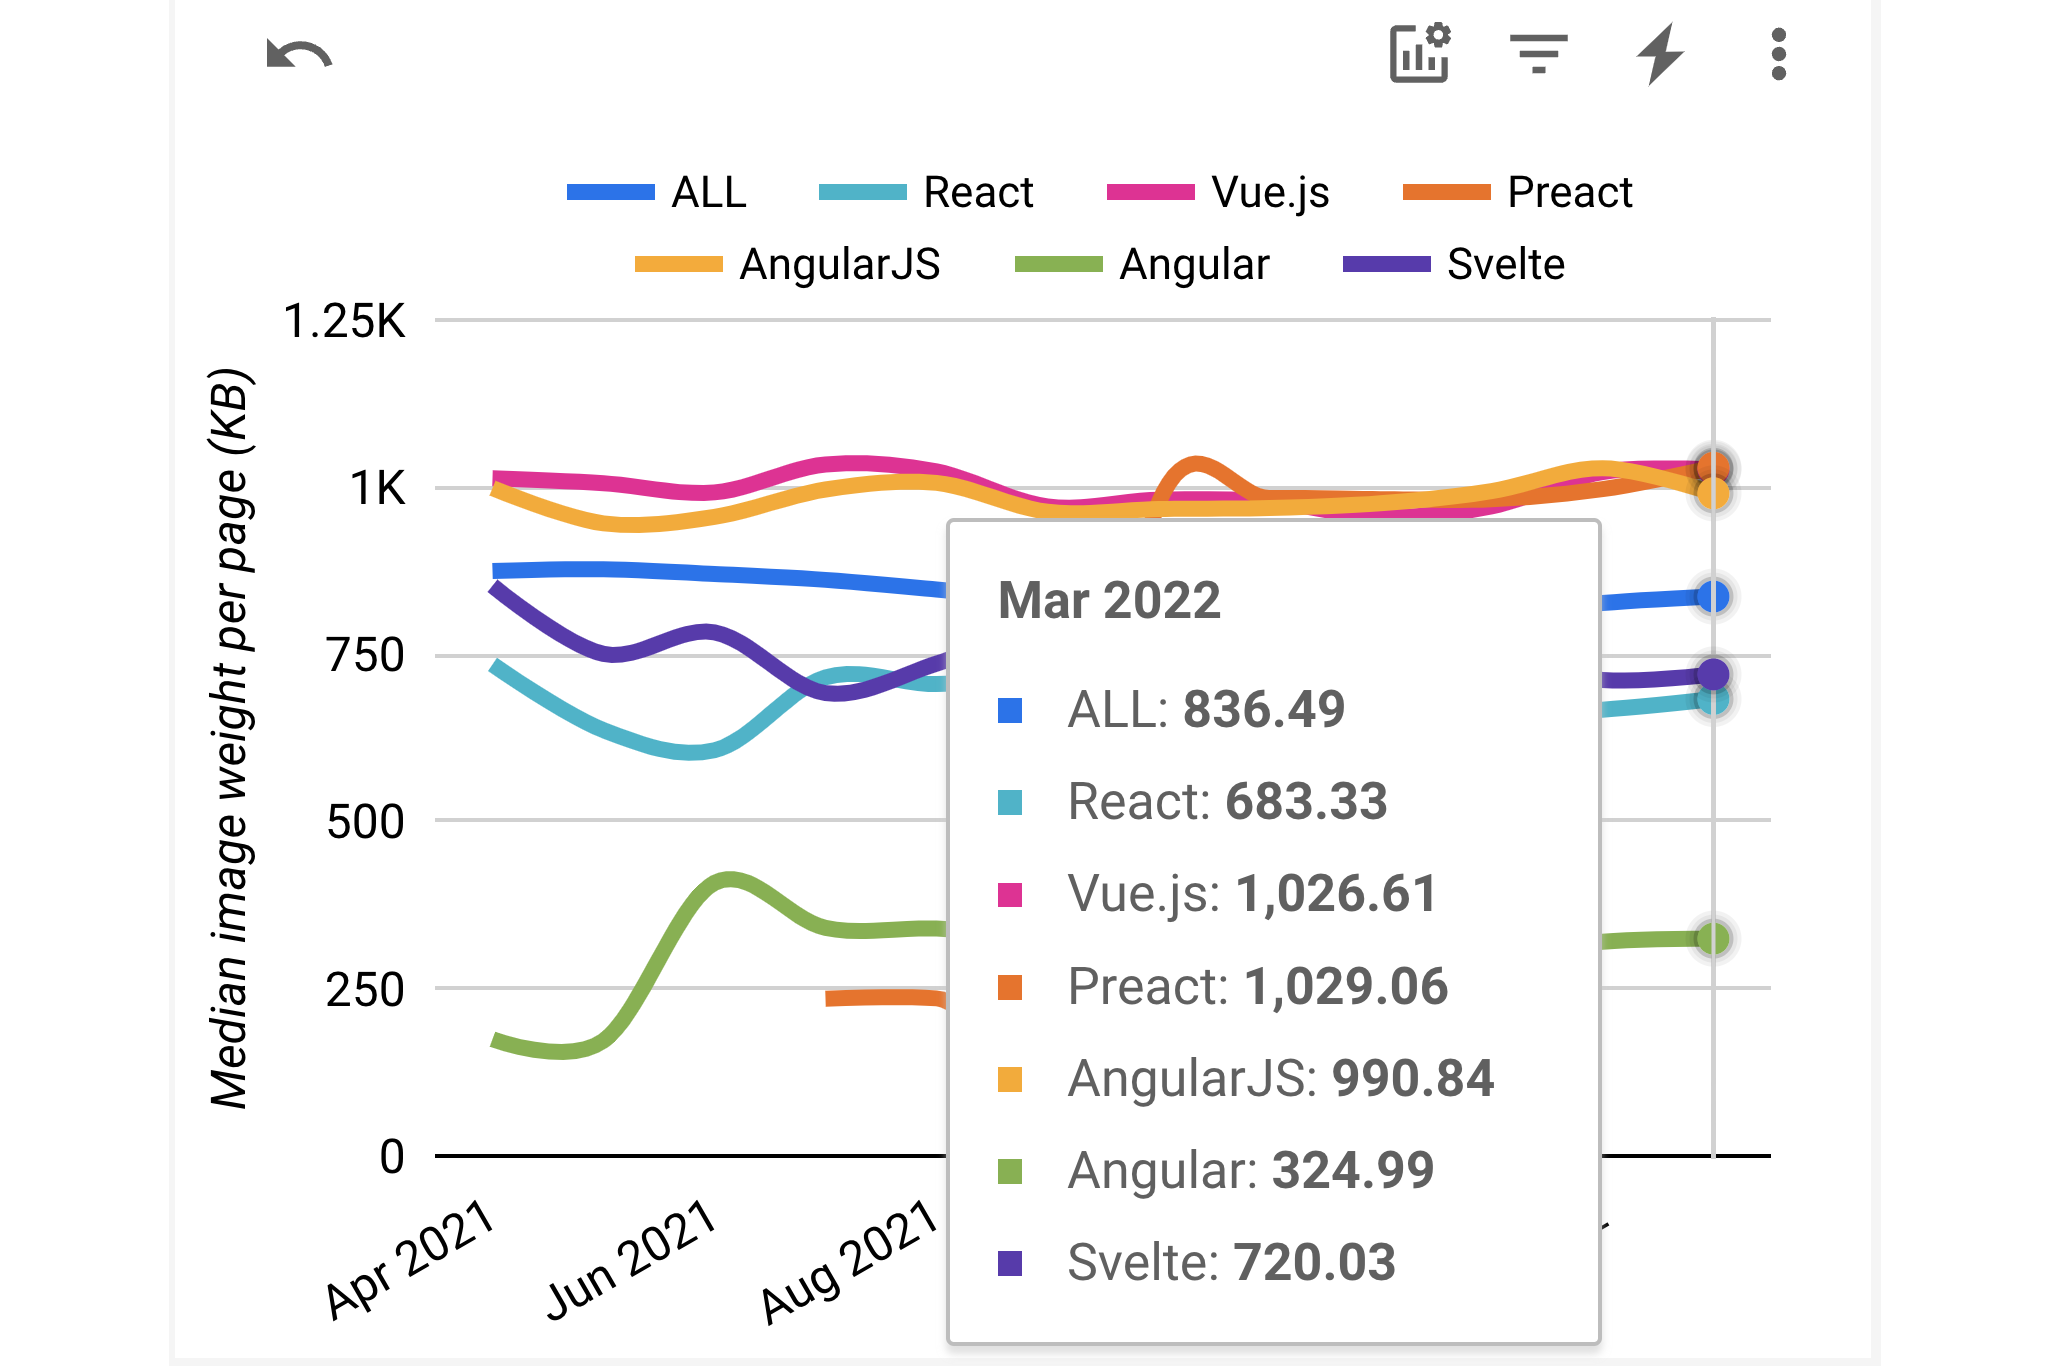
This may have to do with top sites being more content-rich. In particular, top sites are likely to have more ads in them, which are primarily images. And, as we will see, there are other possible explanations as well.
The Impact Of SSR And SSG
As Jason Miller stated in the tweet that I previously quoted, technical choices involving webpage delivery have the greatest impact on the CWV metrics, in particular on LCP. Techniques such as Server-Side Rendering (SSR) and Static Site Generation (SSG) deliver contentful HTML to the browser from the get-go, enabling it to display the content immediately as it arrives. This is usually much earlier than visual content can be generated by client-side rendering techniques, especially when the contentful HTML is cached in a CDN or the browser itself. However, properly implementing the required infrastructure for this method of operation can be challenging when using a JavaScript framework. As a result, in recent years we’ve witnessed the introduction of multiple web application frameworks that provide this functionality out-of-the-box for the leading JavaScript frameworks and UI libraries.
Given all this, we expect websites built using these web application frameworks to have a noticeably higher ratio of good CWV metrics than websites built using just the JavaScript frameworks or libraries.
To determine if this is indeed the case, I used the Core Web Vitals Technology Report to compare the ratio of websites having good CWV for React, Vue and Svelte in general with the same ratio for the leading web application frameworks that are built on top of them:
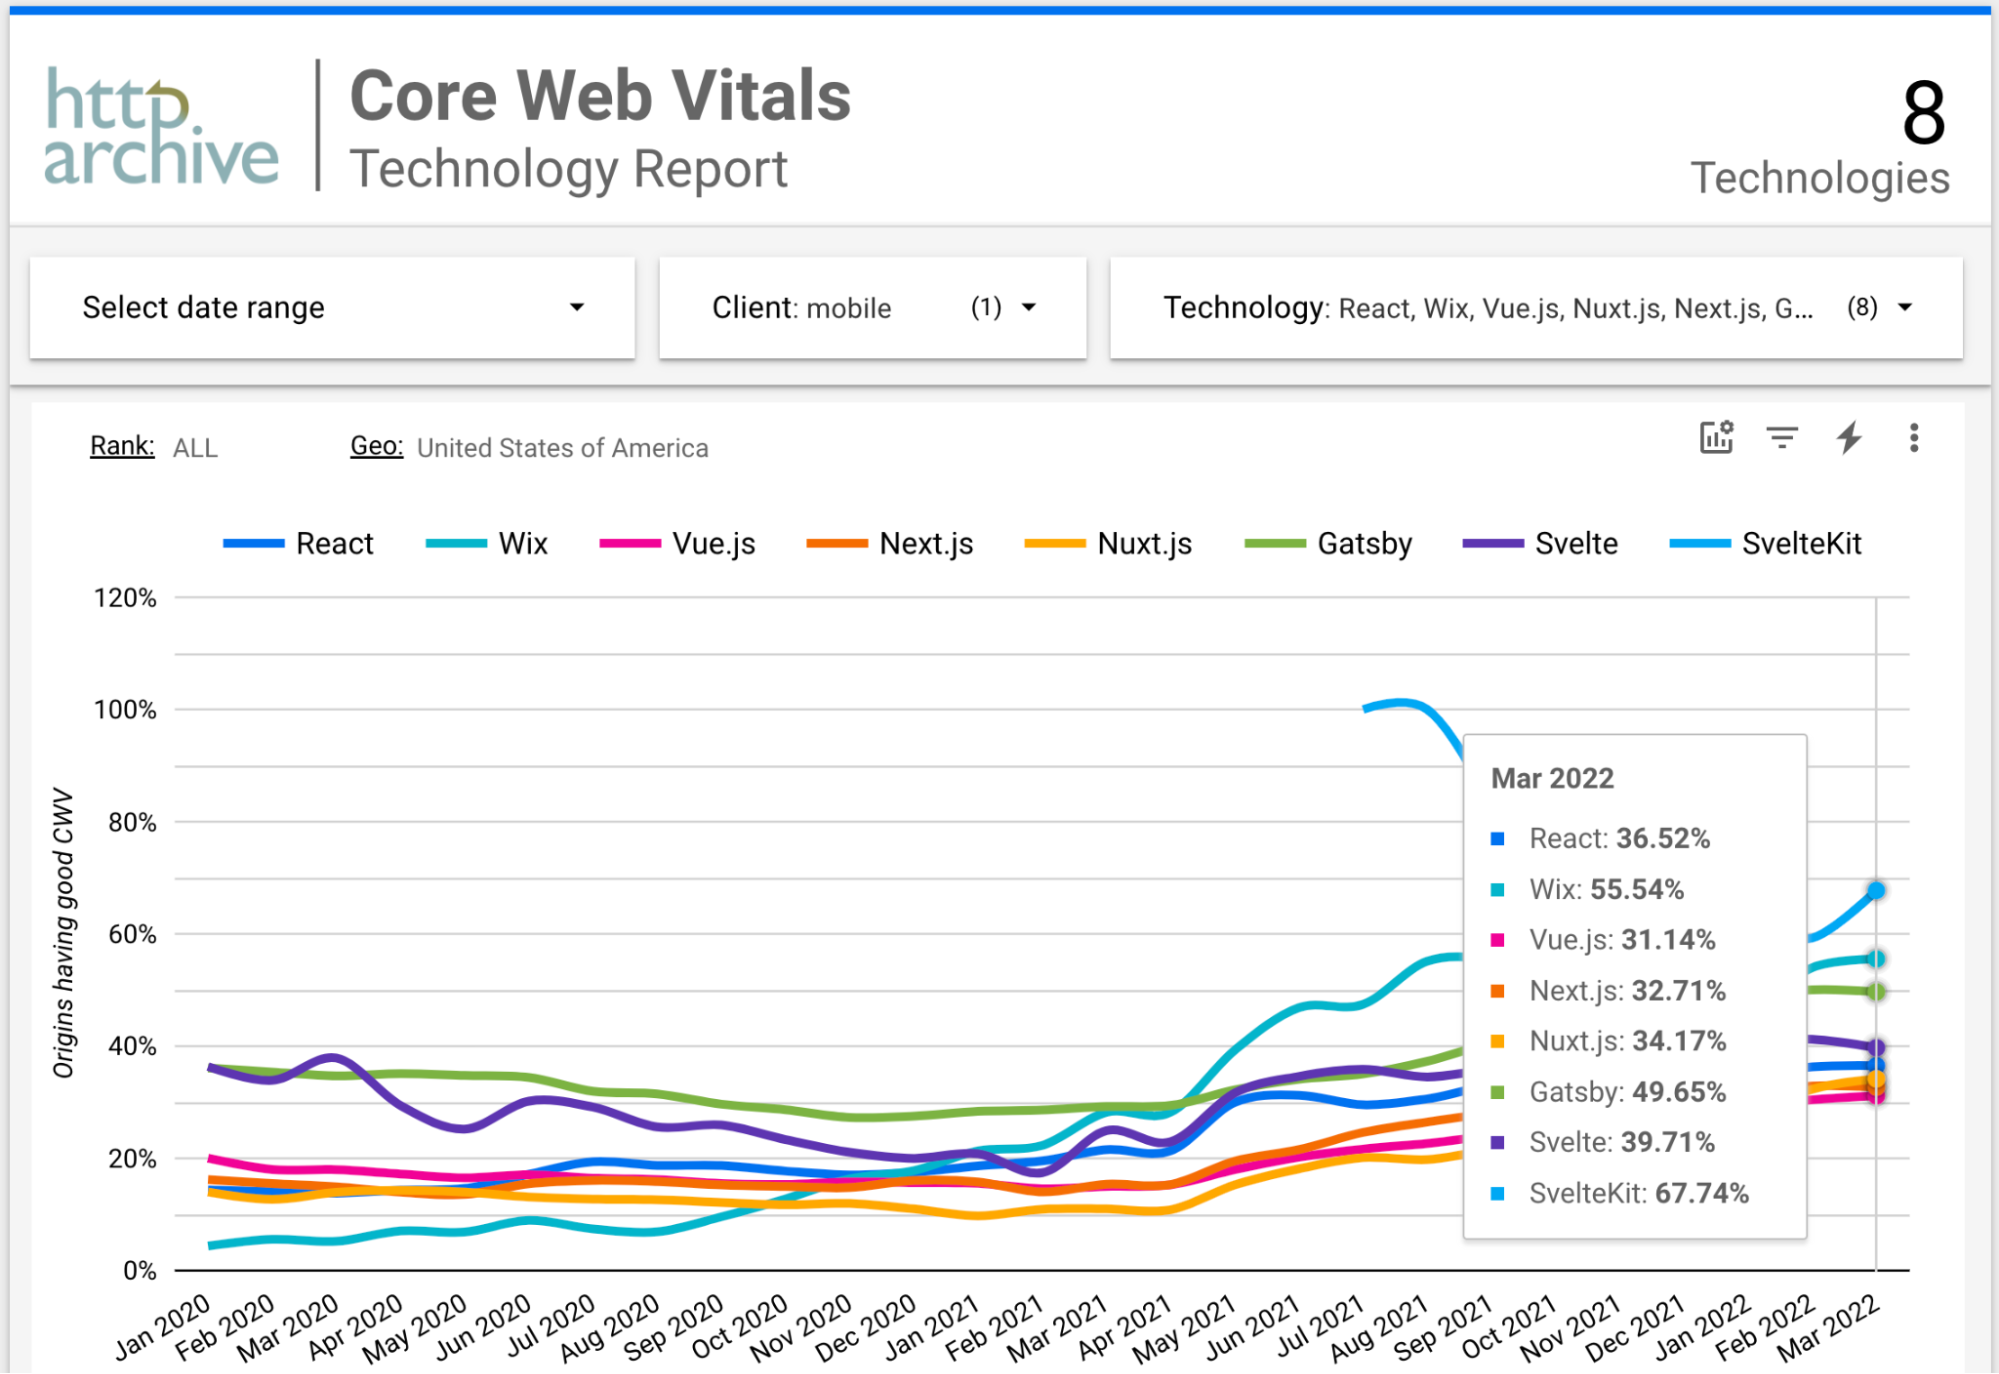
We immediately notice that SvelteKit is able to provide much higher performance than everything else. That being said, there are only 33 websites in this dataset that use SvelteKit. This number is too low to draw conclusions regarding its ability to consistently deliver good performance. But it will be interesting to see if its performance holds up as its usage increases.
We can see that while the Gatsby framework does indeed provide a significantly higher ratio of good CWV than React in general, this is not the case for NextJS. And while NuxtJS does provide a better ratio than Vue in general, that ratio is still lower than for React.
Also, why did I include Wix in this graph? After all, Wix is not a web application framework built on top of a JavaScript framework. Or is it?
Actually, Wix is implemented using React, and as a result, every Wix website is also identified as a React website, just like Gatsby and NextJS. In other words, even though you don’t explicitly write React code when using Wix — after all, it’s a drag-and-drop website builder — it does generate a React website for you. Moreover, Wix also employs SSR like Next.js and uses CDN like both NextJS and Gatsby. And it has a higher good performance ratio than either of them.
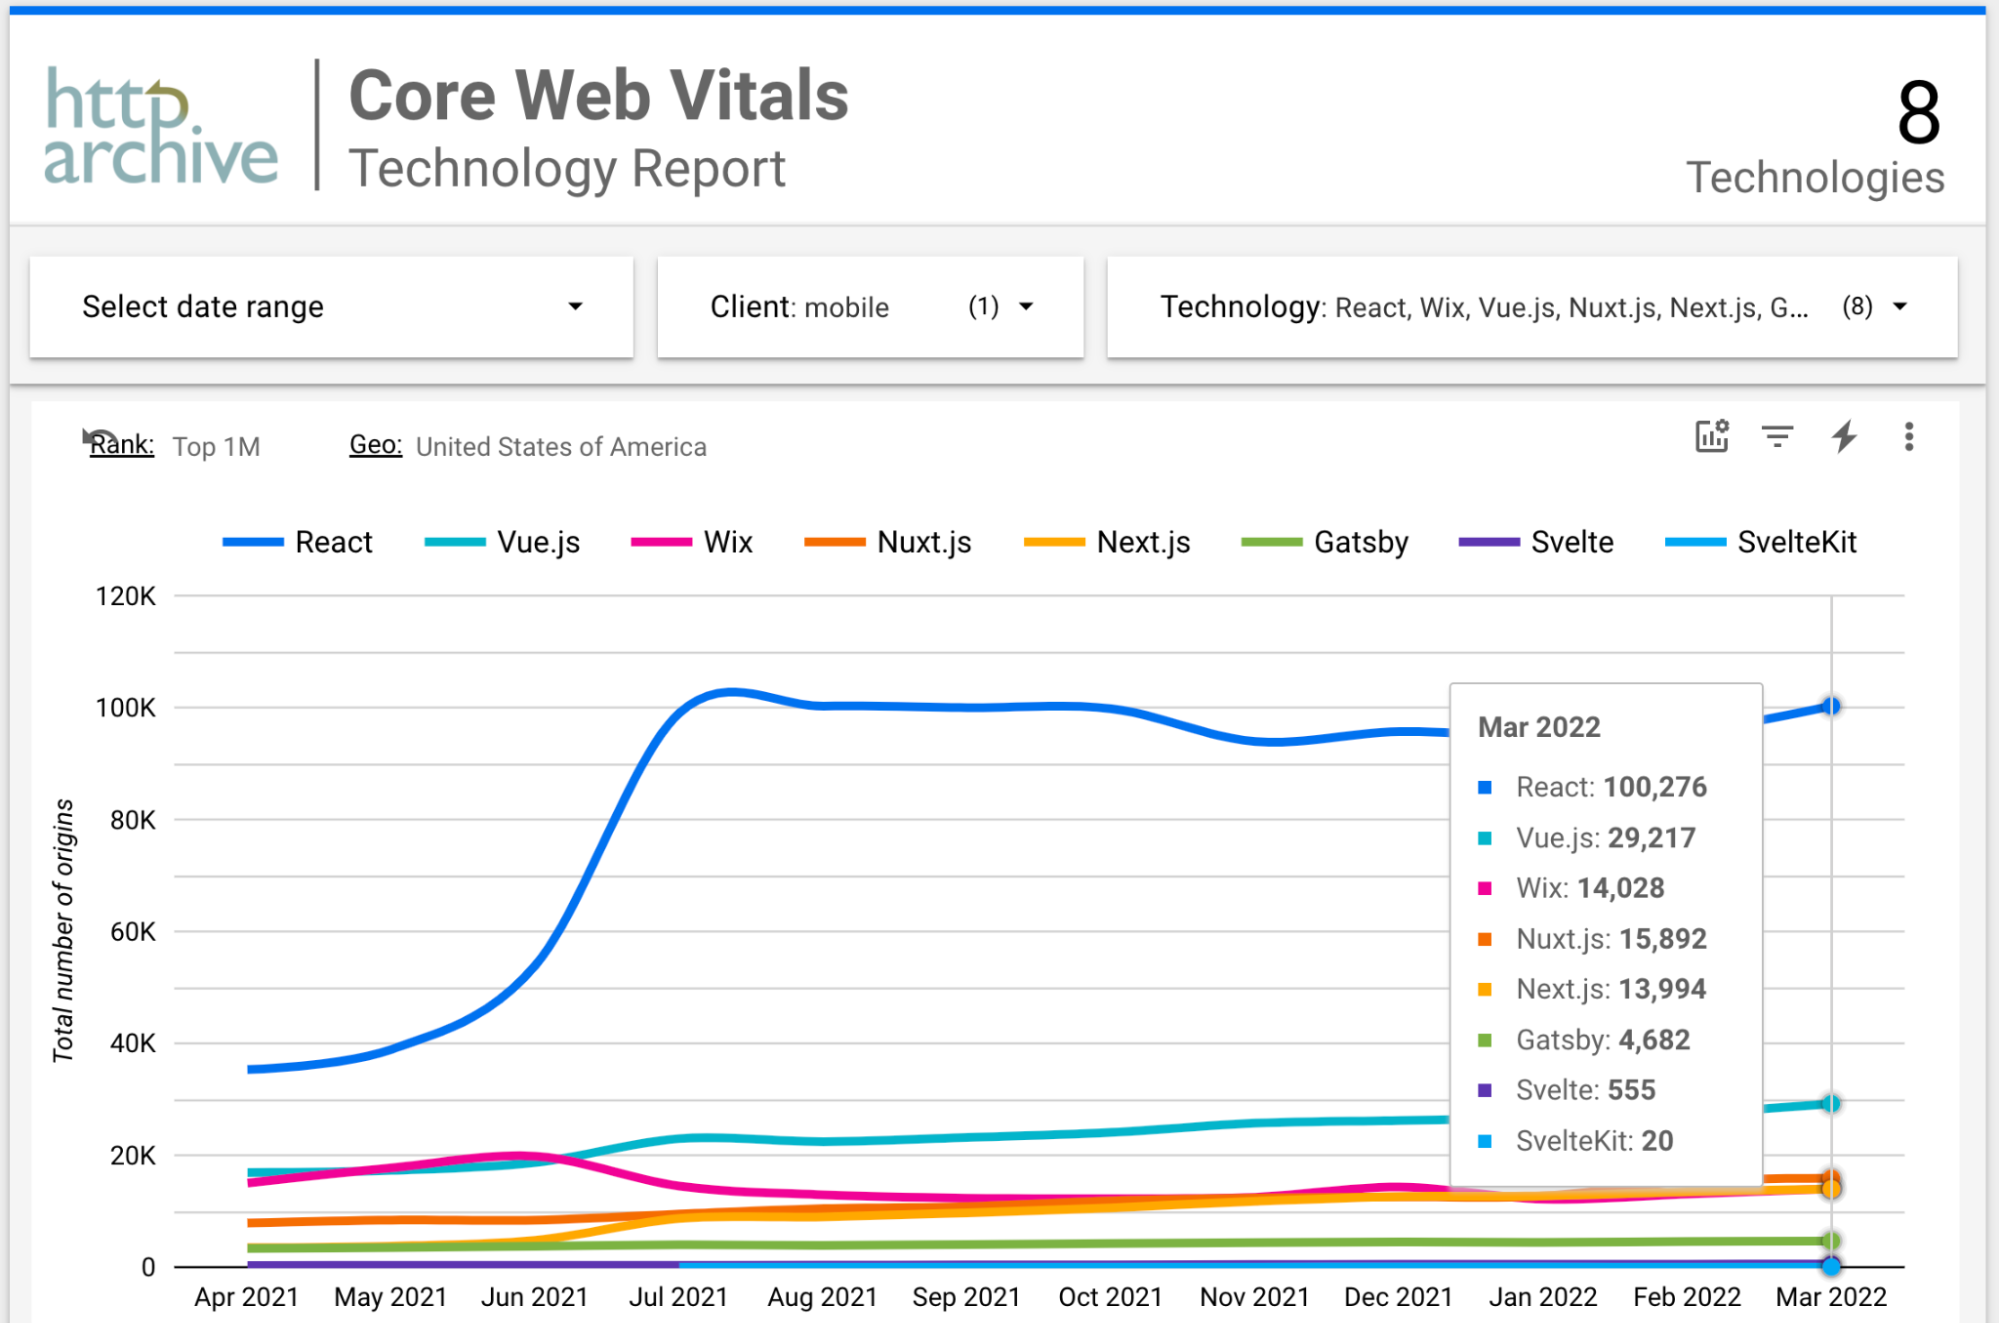
Now let’s consider the number of websites built using each one of these technologies:
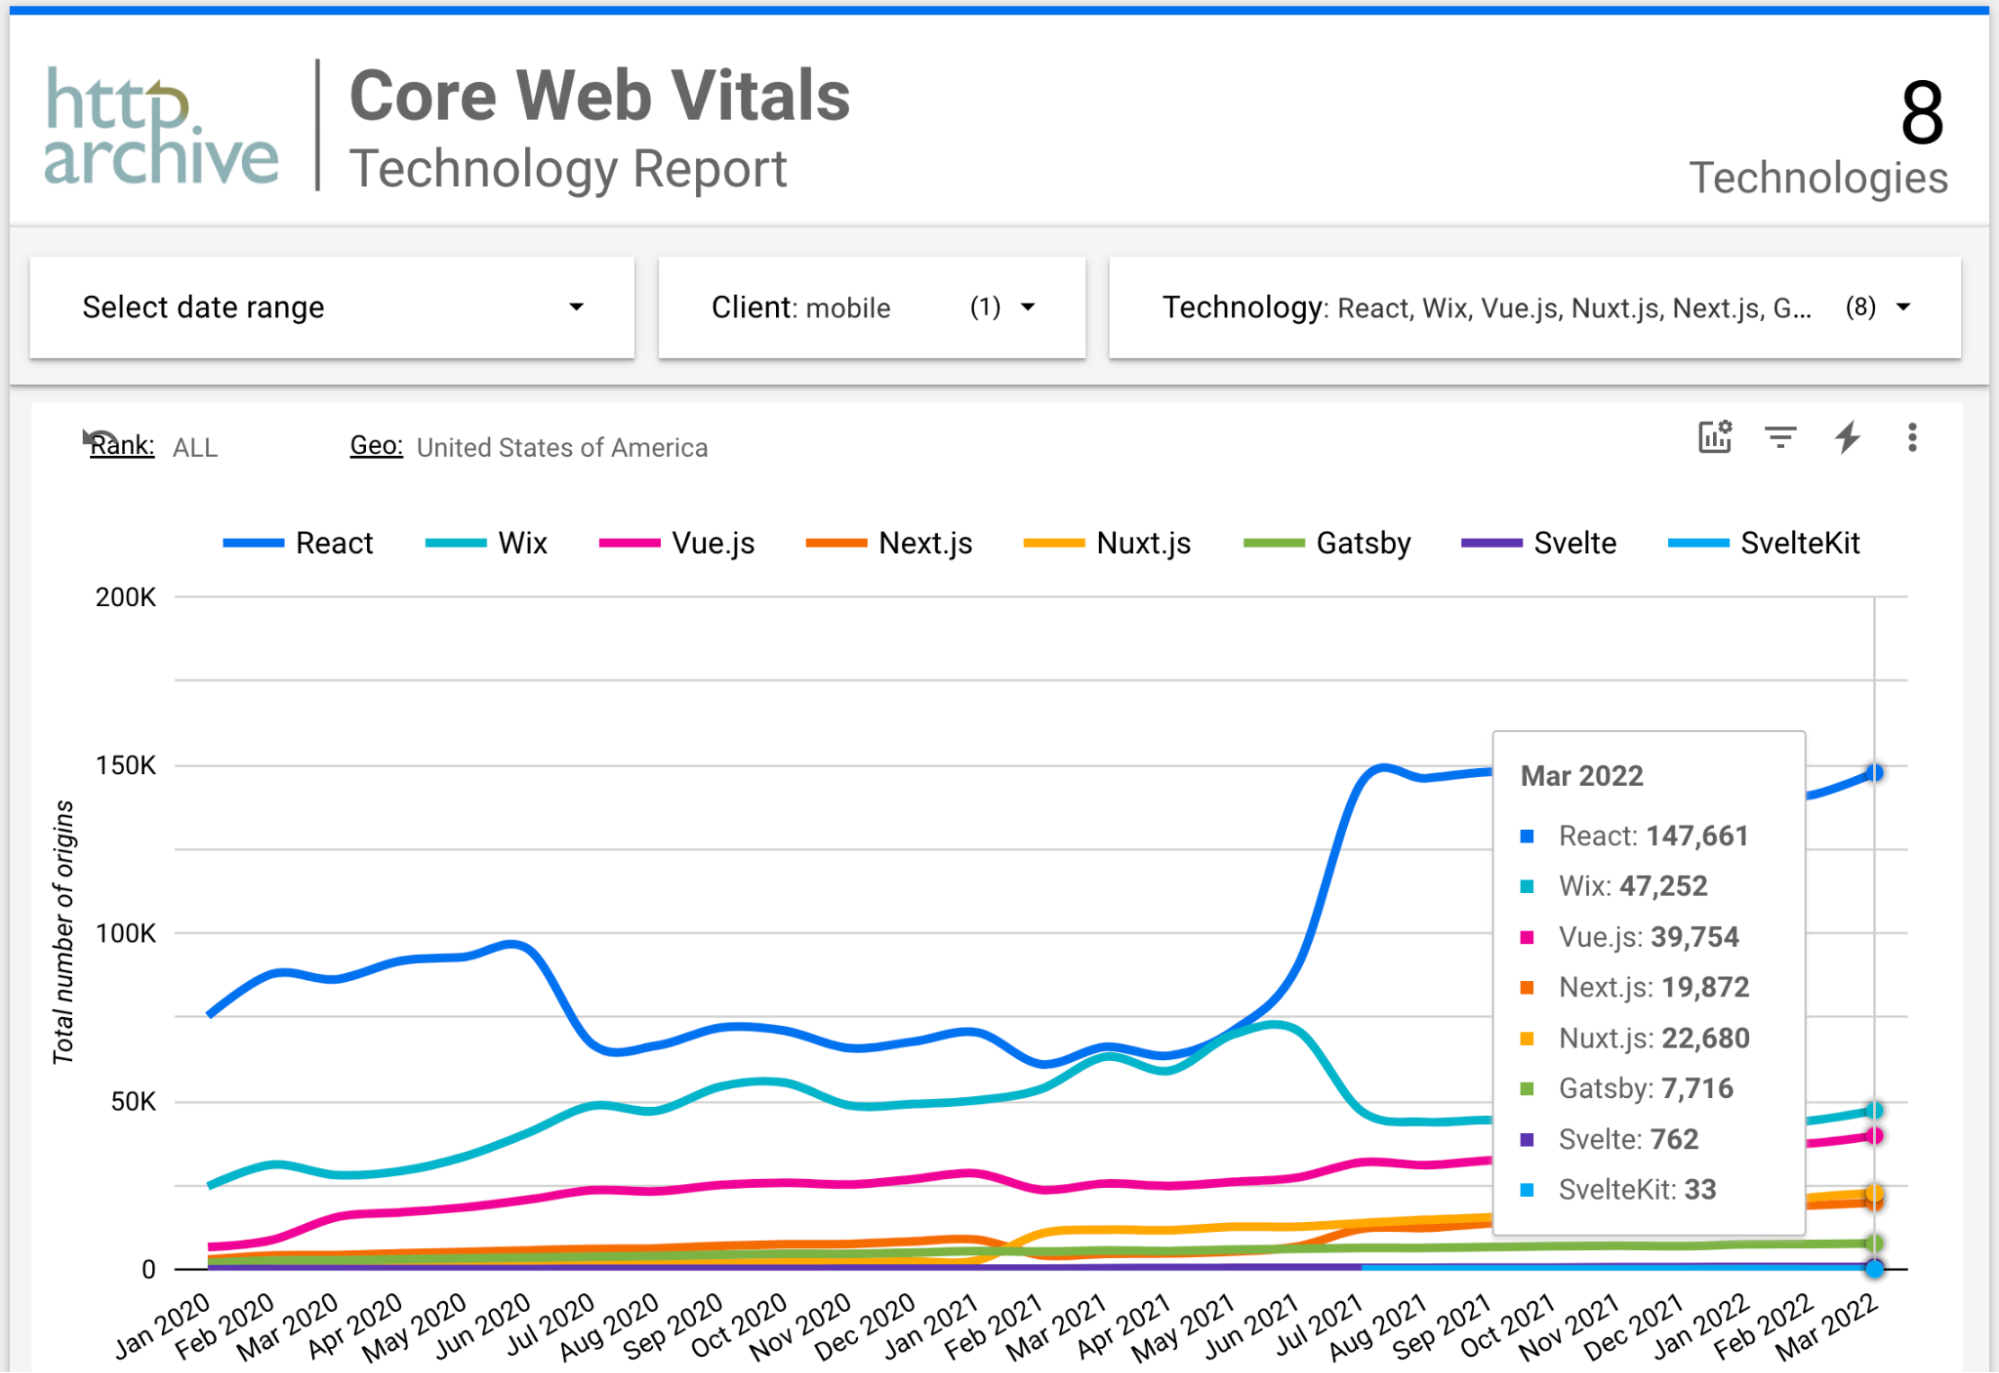
Not only does Wix significantly outpace the popular web application frameworks, but in fact about a third of React websites in the USA are actually Wix websites!
This is significant because, at such a high ratio, Wix performance noticeably impacts the performance measured for React websites as a whole. Fortunately, as we saw in the performance graph, Wix actually has a higher ratio of good CWV than React sites in general. In other words, Wix actually raises the performance scores measured for React.
But when we limit to the top 1,000,000 websites in the USA the ratios change substantially:
The ratio of Wix and all other web application frameworks out of the total React websites drop significantly when looking only at the top 1,000,000 websites. In this dataset, only 14% of React sites are built with Wix. This means that Wix’s impact on React’s general performance is much reduced when looking only at top sites. This is a significant reason why React’s good performance ratio actually degrades when inspecting only the top sites, unlike the other JavaScript frameworks.
In other words, Wix is the solution to the mystery of React’s unexpected performance profile.
Performance Metrics For Web Application Frameworks
But what about NextJS and NuxtJS? Why don’t they provide the expected performance benefits across the board that we see with Gatsby (and also with Wix)? Analyzing each metric individually may reveal the root causes for this behavior.
As before, the FID metric has essentially no impact on the overall performance ratio as all frameworks achieve a good FID ratio above 97%.
Things get more interesting when we compare CLS ratios:
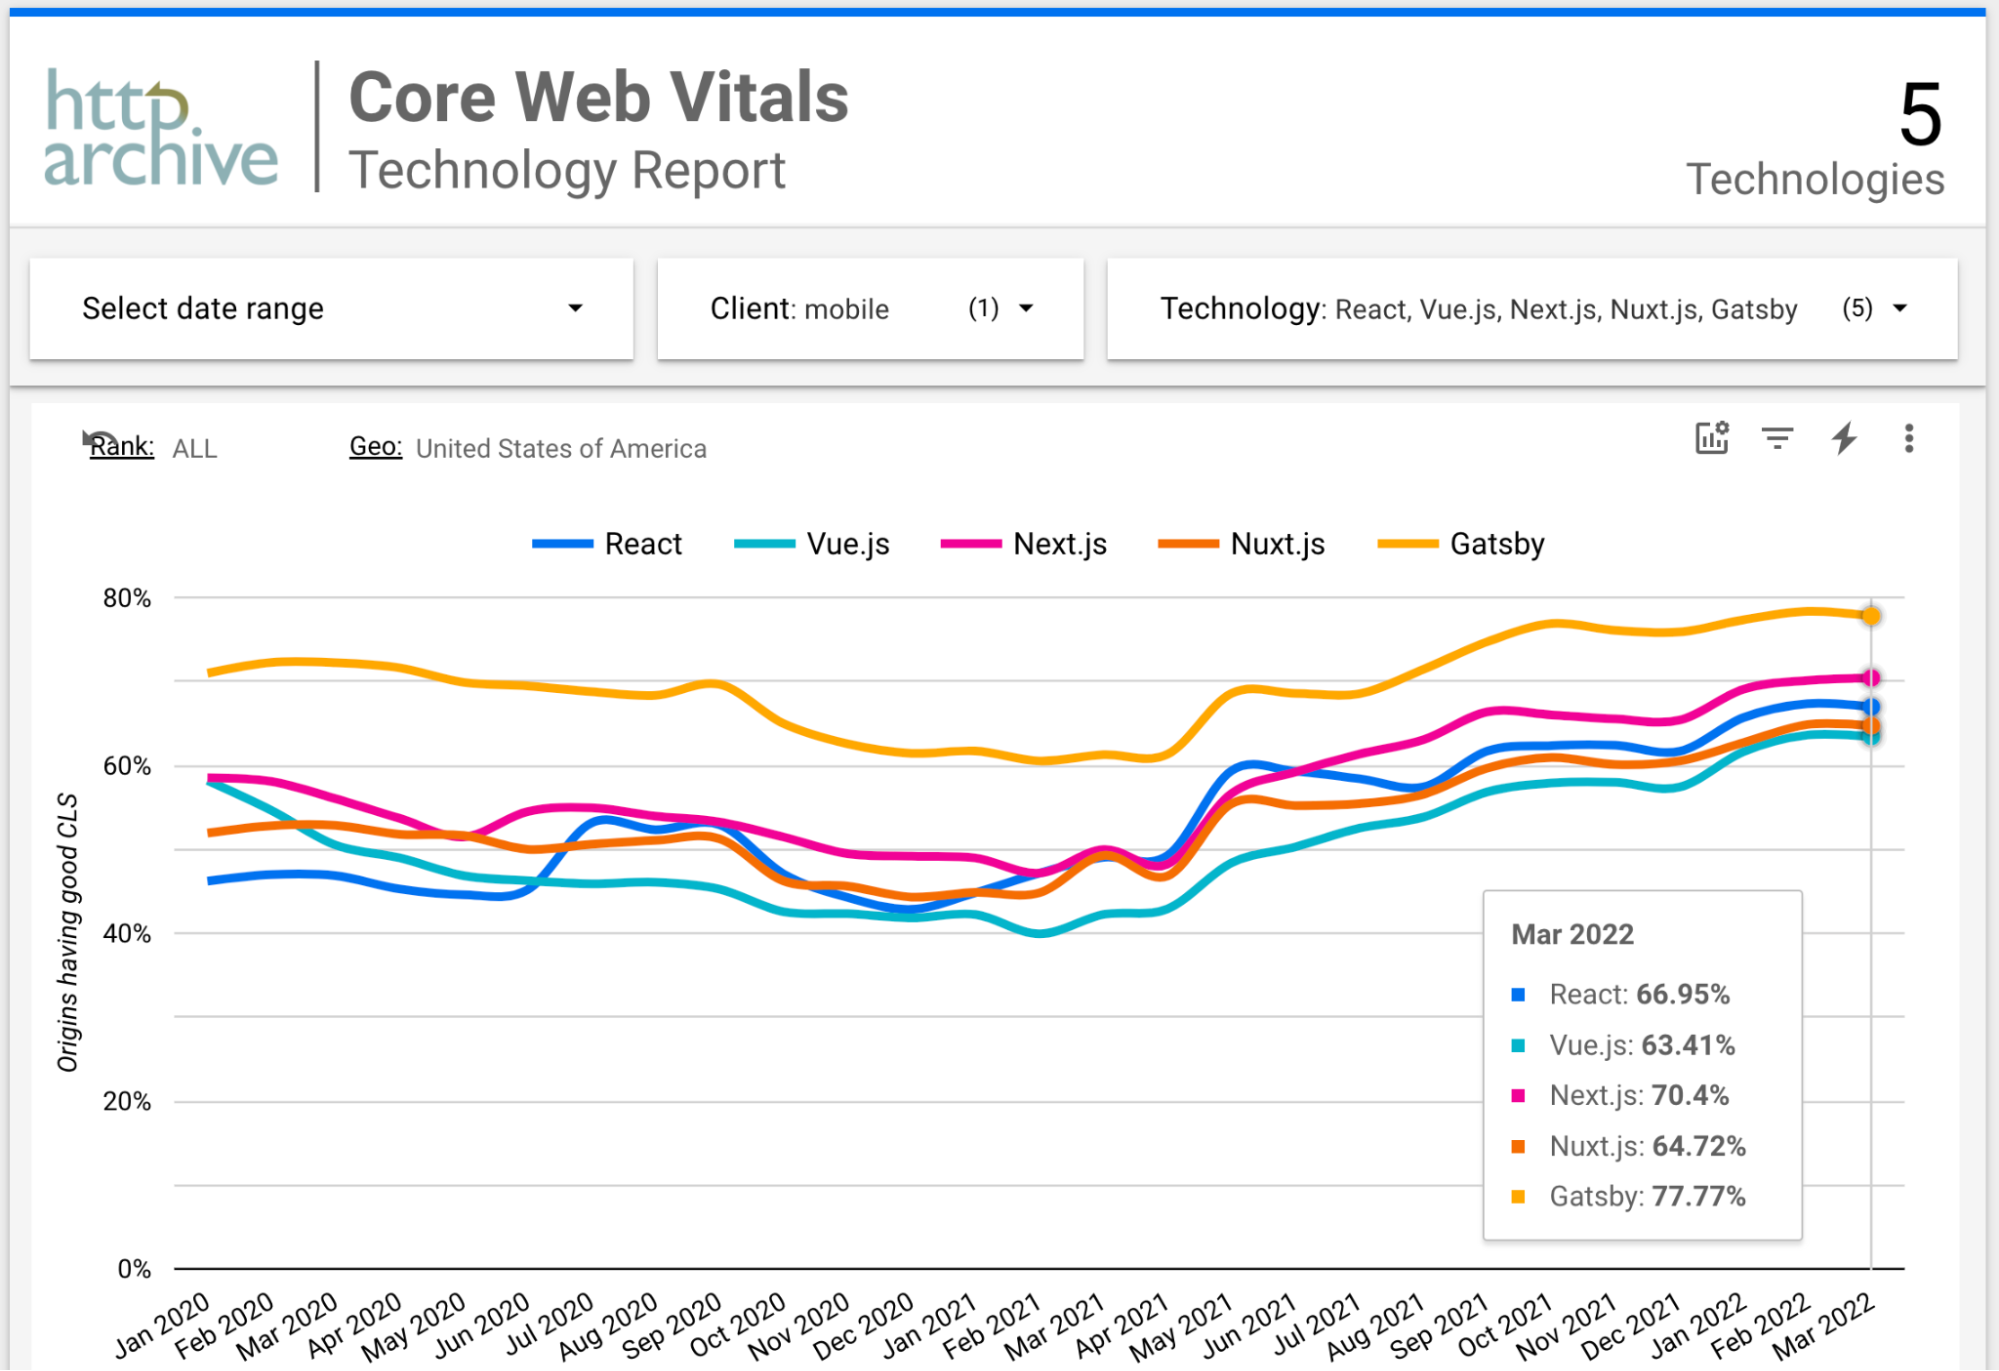
We can see that NextJS actually surpasses React, but that Gatsby is still ahead. Also, NuxtJS is smack in the middle between Vue and React.
Since all these frameworks have essentially the same good FID ratios and close good CLS ratios, this indicates that the main cause of the difference between these frameworks is LCP:
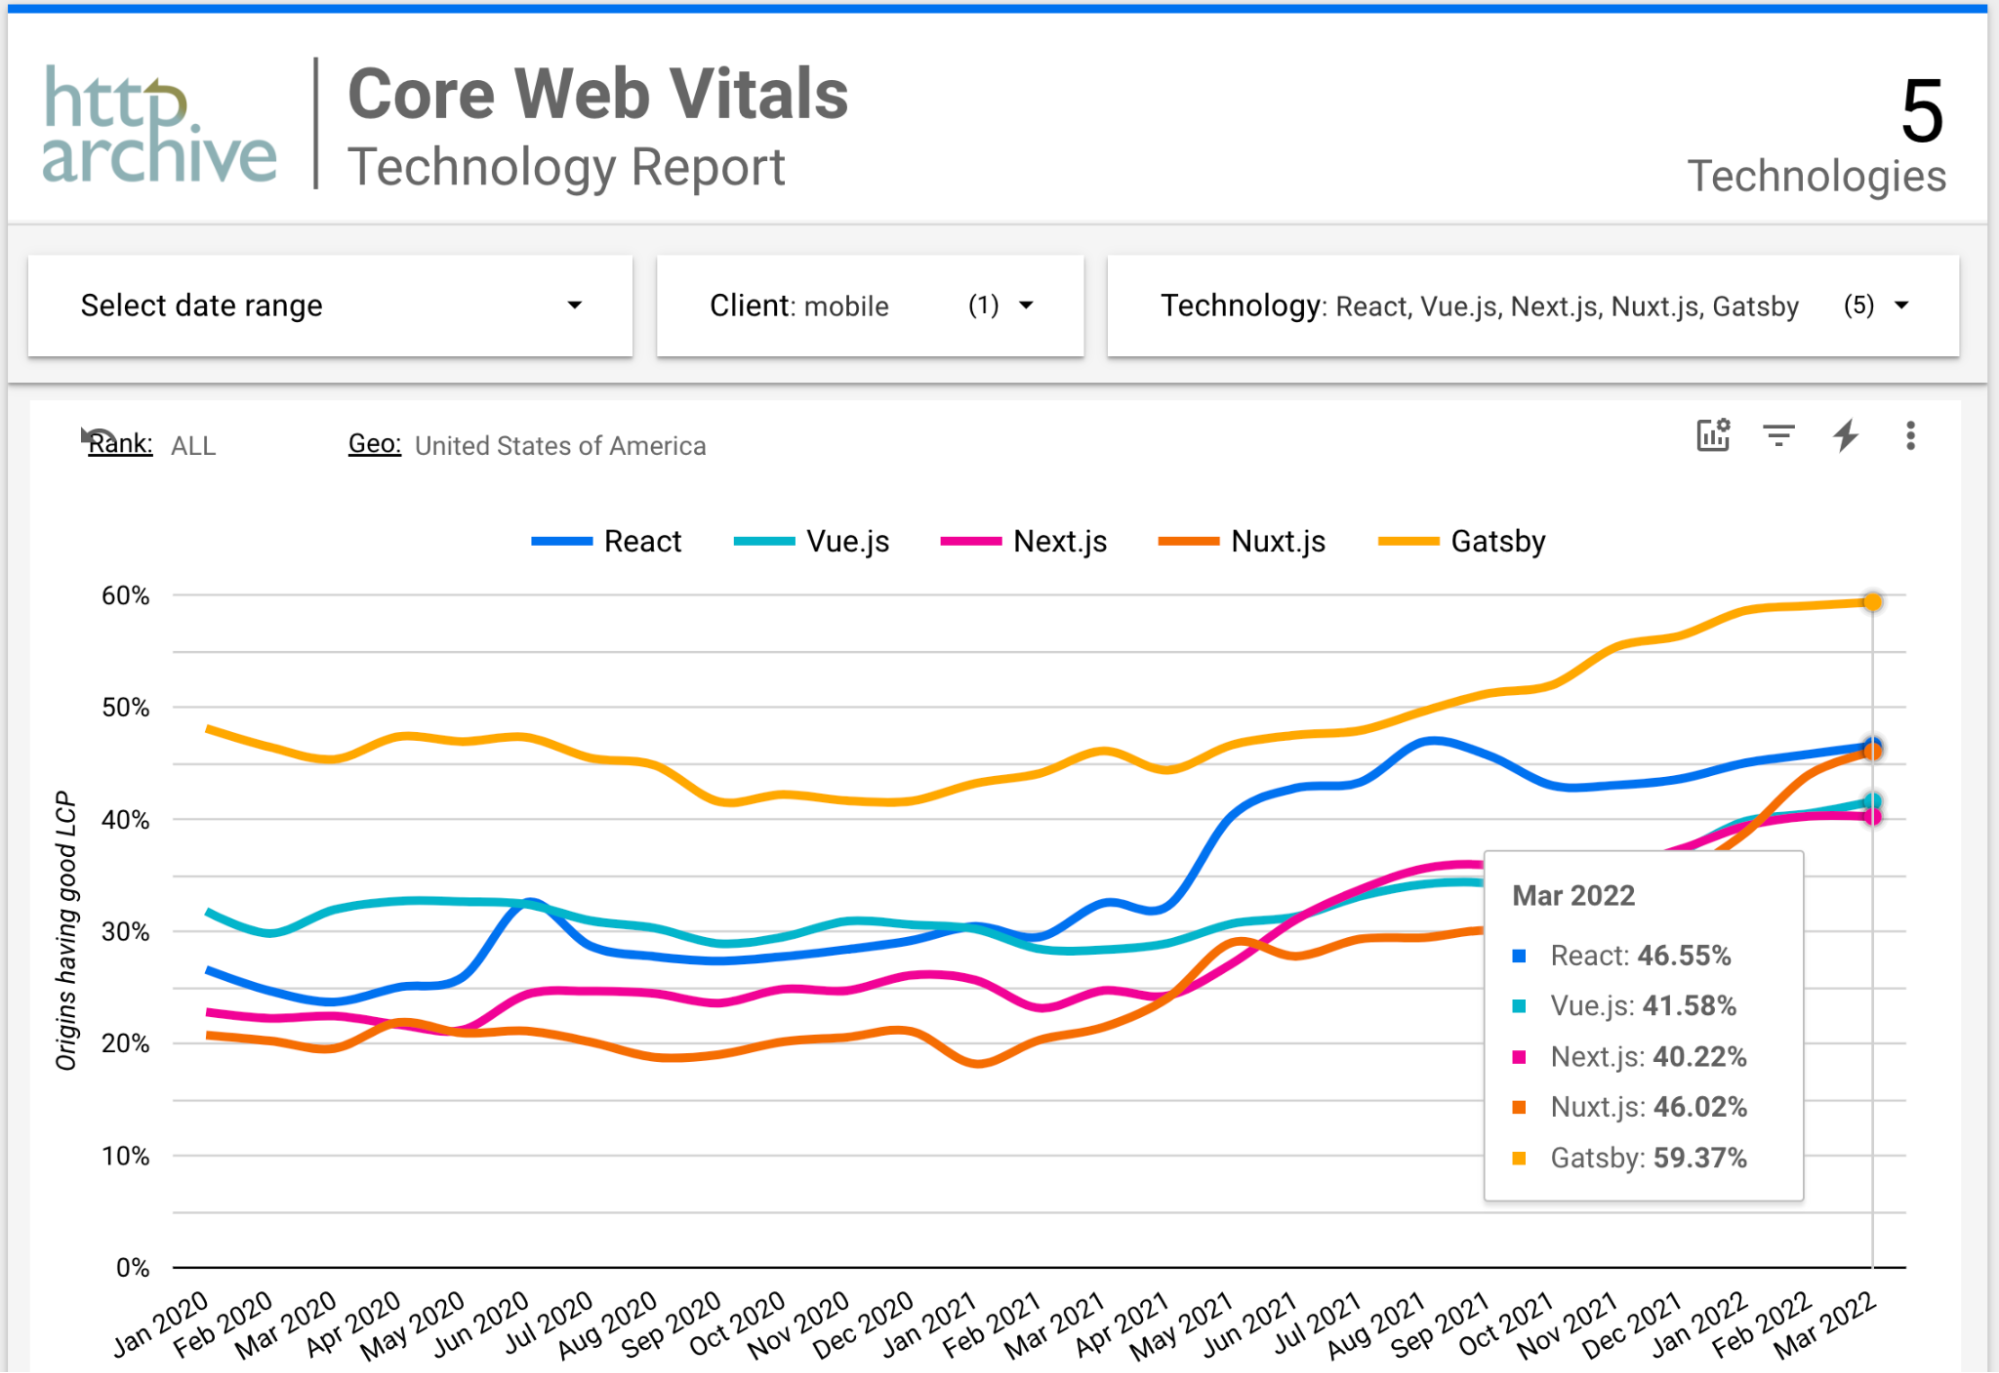
As expected we see that Gatsby is significantly ahead of React, and also that React in general is ahead of Next.js. Given that NextJS utilizes SSR / SSG and modern image formats, this is surprising. Certainly, this is something to watch out for when utilizing that framework.
NuxtJS has made significant progress in this regard in recent months and has surpassed NextJS for good LCP which is essentially the same as React in general.
Let’s see if the LCP differences can be explained by the image download sizes since larger images are often detrimental to LCP:
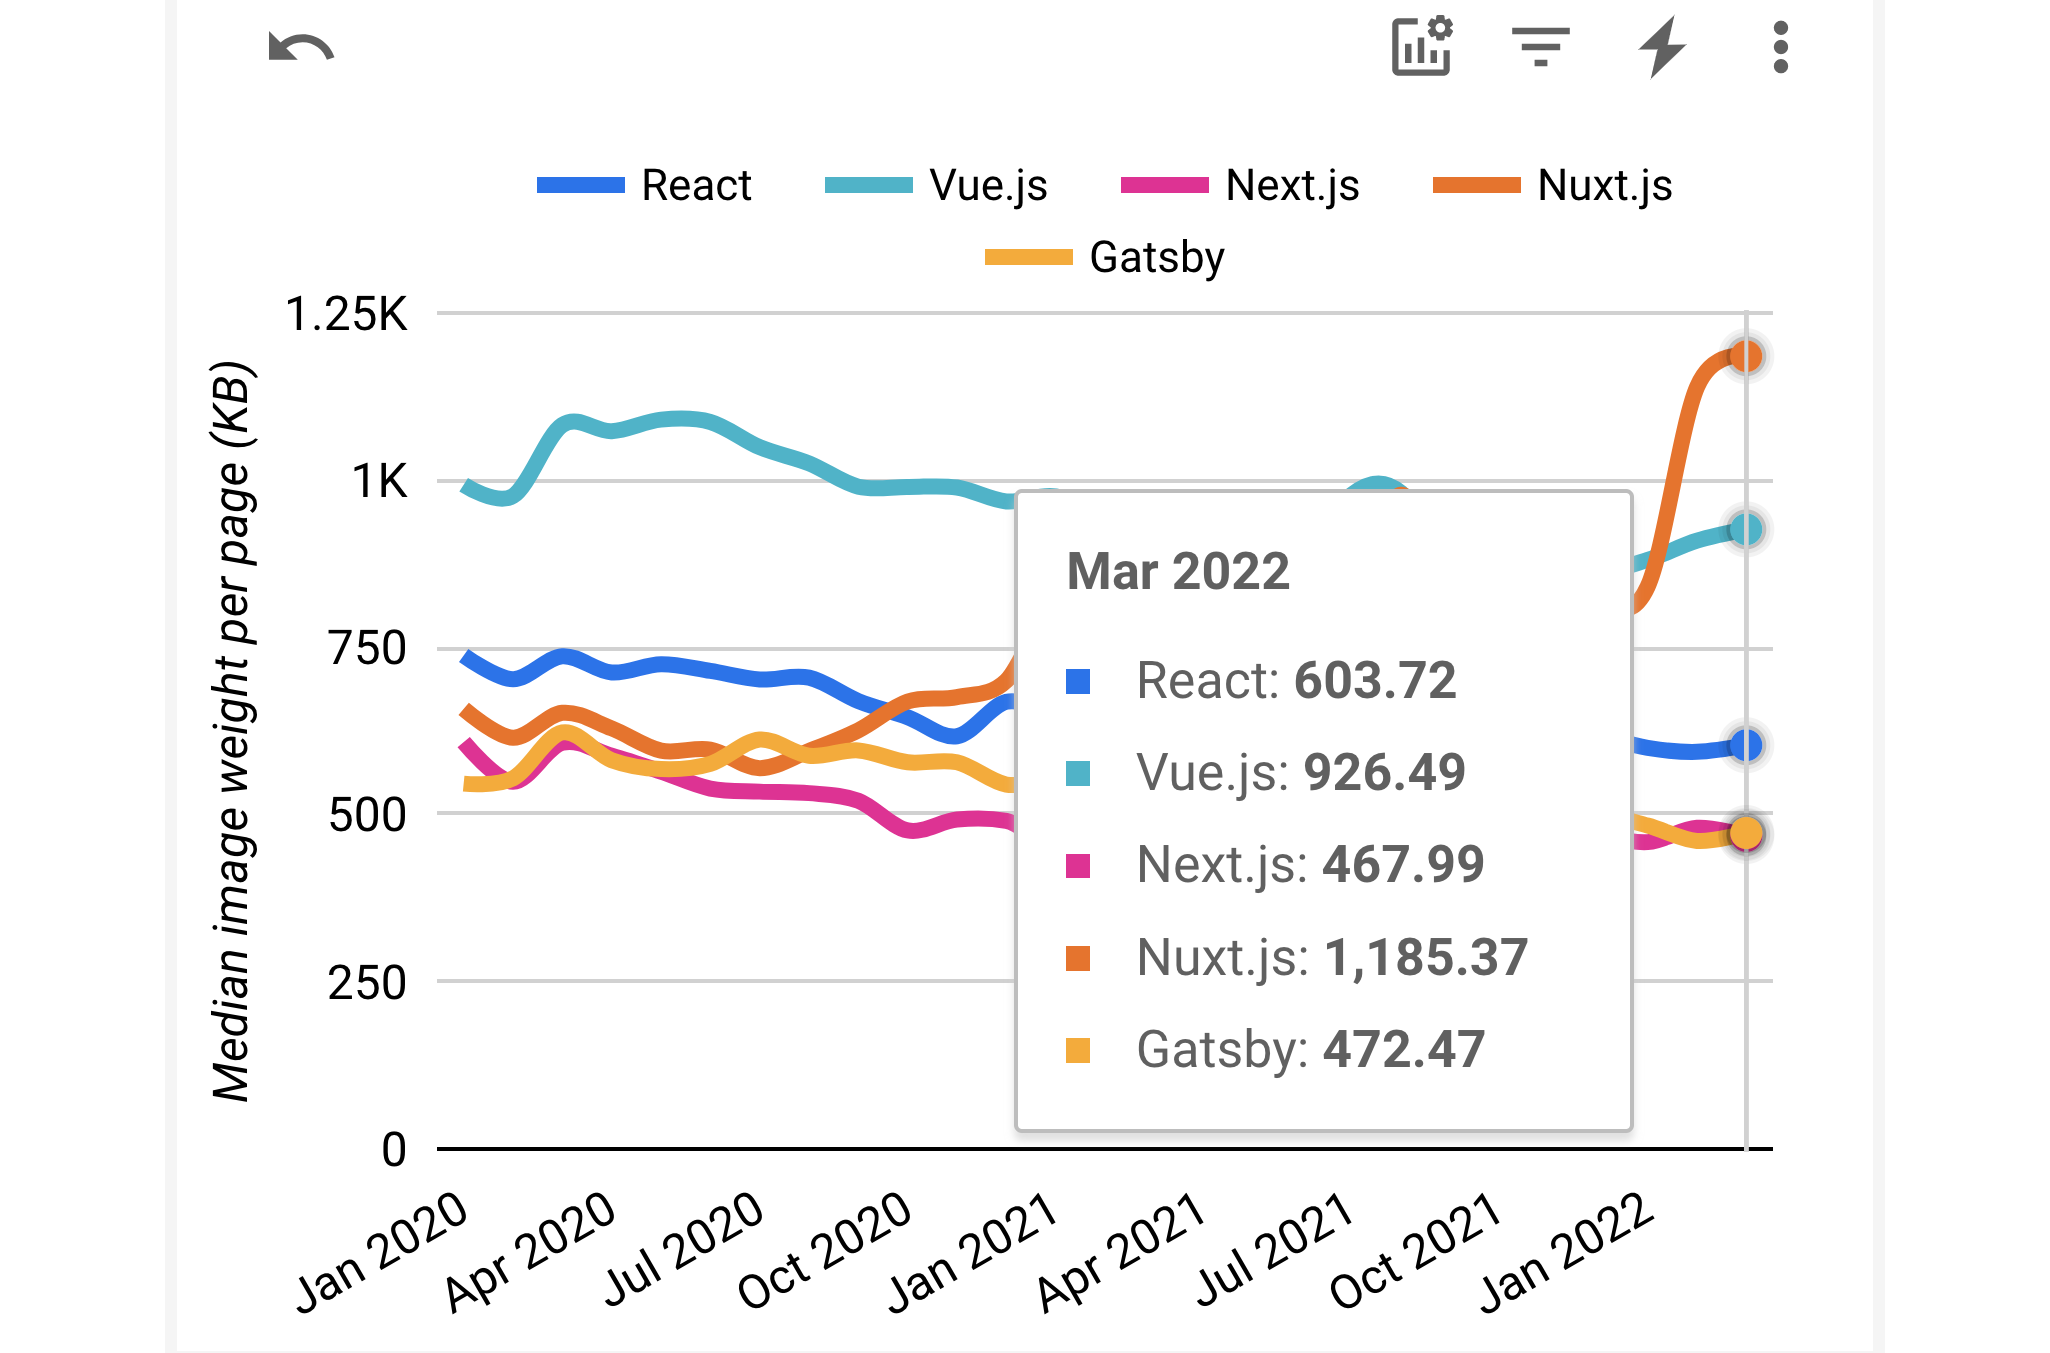
It’s interesting to see that websites using NuxtJS and Vue download significantly more image data than websites that use React, and that NuxtJS is able to achieve a fairly good LCP ratio despite this.
Gatsby and NextJS are both efficient in terms of the amount of the downloaded image data. This means that the improved good LCP ratio that Gatsby provides doesn’t stem just from reduced image sizes. To me, this indicates that Gatsby is likely able to start the download of the largest image sooner and to better prioritize it versus other page resources.
Interestingly, the Gatsby homepage uses WebP for images and the NextJS homepage uses AVIF.
Summary
All of the frameworks that I reviewed in this article have good performance ratios higher than 0%, which means that you can build fast-loading sites, as measured by CWV, using any of them. Likewise, all these frameworks have good performance ratios that are lower than 100%, which means that you can also build slow-loading sites using any of them.
That said, we saw significant differences between the good performance ratios of the various frameworks. This means that the likelihood that a website built using a specific framework will have good performance can be very different than for another framework. Certainly, this is something to consider when deciding which framework to use.
On the other hand, we also saw that such differences can be misleading — for example, it initially appeared that React has a noticeably higher-good performance ratio than Vue. But when we effectively excluded most Wix websites, which are included in React’s statistics, by looking only at higher traffic sites, Vue actually catches up with React.
In addition, certain frameworks that have a reputation for greater emphasis on performance, such as Preact and Svelte, don’t necessarily have an advantage for CWV. It will be interesting to see if their impact increases when Google introduces a new responsiveness metric to replace FID in CWV.
Even more surprisingly, some Web Application frameworks don’t have an advantage either, despite their built-in support for SSG / SSR and the use of CDNs. In other words, using a Web Application framework is not a silver bullet for performance.
In particular, it appears that NextJS and NuxtJS have a ways to go in terms of increasing the probability that sites built using them have good CWV. Their graphs are on a significant upward trend, especially NuxtJS, but are still noticeably lower than Gatsby or Wix or even the ratio for all websites in general. Hopefully, their improvements will continue and they’ll succeed in catching up.
Further Reading
- Tight Mode: Why Browsers Produce Different Performance Results
- How To Build A Multilingual Website With Nuxt.js
- Converting Plain Text To Encoded HTML With Vanilla JavaScript
- How To Make A Strong Case For Accessibility


